| Multiple Linear Regression - Estimated Regression Equation |
| Jaar[t] = + 1941.73074167 + 0.0563566777893992Omzet_product[t] -1.11837153621192e-05Uitgaven_voor_promotie[t] + 0.0678938598601972Prijs_product[t] -0.0252914328395057Gem_budget[t] + 0.0297361210531898Index_cons_vertrouwen[t] + 0.000770357985107064uitgave_lok_prom[t] + e[t] |
| Multiple Linear Regression - Ordinary Least Squares | |||||
| Variable | Parameter | S.D. | T-STAT H0: parameter = 0 | 2-tail p-value | 1-tail p-value |
| (Intercept) | 1941.73074167 | 40.359712 | 48.1106 | 0 | 0 |
| Omzet_product | 0.0563566777893992 | 0.066734 | 0.8445 | 0.407089 | 0.203544 |
| Uitgaven_voor_promotie | -1.11837153621192e-05 | 6.3e-05 | -0.1774 | 0.860714 | 0.430357 |
| Prijs_product | 0.0678938598601972 | 0.074727 | 0.9086 | 0.373005 | 0.186503 |
| Gem_budget | -0.0252914328395057 | 0.030048 | -0.8417 | 0.408615 | 0.204308 |
| Index_cons_vertrouwen | 0.0297361210531898 | 0.026782 | 1.1103 | 0.278347 | 0.139173 |
| uitgave_lok_prom | 0.000770357985107064 | 0.002971 | 0.2593 | 0.797735 | 0.398867 |
| Multiple Linear Regression - Regression Statistics | |
| Multiple R | 0.338359289691637 |
| R-squared | 0.114487008920629 |
| Adjusted R-squared | -0.116516380056598 |
| F-TEST (value) | 0.495607486225734 |
| F-TEST (DF numerator) | 6 |
| F-TEST (DF denominator) | 23 |
| p-value | 0.804978518568233 |
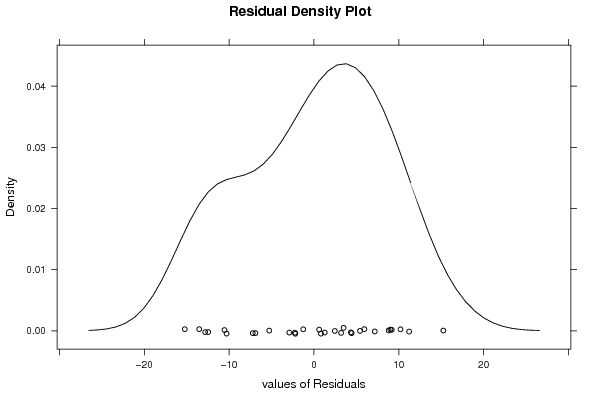
| Multiple Linear Regression - Residual Statistics | |
| Residual Standard Deviation | 9.3021513347391 |
| Sum Squared Residuals | 1990.19044745093 |
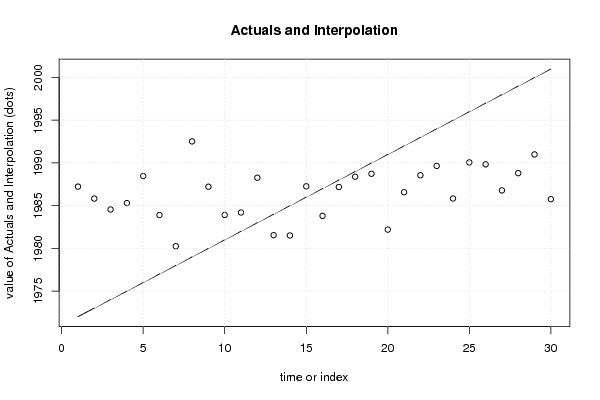
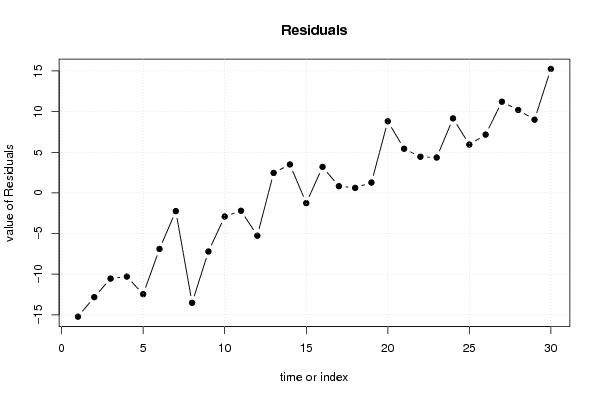
| Multiple Linear Regression - Actuals, Interpolation, and Residuals | |||
| Time or Index | Actuals | Interpolation Forecast | Residuals Prediction Error |
| 1 | 1972 | 1987.22549582155 | -15.2254958215536 |
| 2 | 1973 | 1985.82474562787 | -12.824745627871 |
| 3 | 1974 | 1984.54333808641 | -10.5433380864098 |
| 4 | 1975 | 1985.29780764268 | -10.2978076426802 |
| 5 | 1976 | 1988.46485235599 | -12.4648523559901 |
| 6 | 1977 | 1983.89618590688 | -6.89618590688065 |
| 7 | 1978 | 1980.24600458013 | -2.24600458013256 |
| 8 | 1979 | 1992.52069889765 | -13.5206988976493 |
| 9 | 1980 | 1987.2116064991 | -7.21160649909742 |
| 10 | 1981 | 1983.90785813929 | -2.90785813929229 |
| 11 | 1982 | 1984.19589845504 | -2.19589845504395 |
| 12 | 1983 | 1988.26402869606 | -5.26402869605737 |
| 13 | 1984 | 1981.54090785694 | 2.4590921430552 |
| 14 | 1985 | 1981.50394035341 | 3.49605964658612 |
| 15 | 1986 | 1987.25964236959 | -1.25964236959146 |
| 16 | 1987 | 1983.80072867427 | 3.19927132572914 |
| 17 | 1988 | 1987.17729346204 | 0.822706537960378 |
| 18 | 1989 | 1988.38345541334 | 0.616544586659173 |
| 19 | 1990 | 1988.72805671096 | 1.27194328903943 |
| 20 | 1991 | 1982.18917519251 | 8.81082480748874 |
| 21 | 1992 | 1986.56972950357 | 5.43027049642737 |
| 22 | 1993 | 1988.55679144815 | 4.44320855185485 |
| 23 | 1994 | 1989.64818662647 | 4.3518133735275 |
| 24 | 1995 | 1985.83377054907 | 9.16622945093324 |
| 25 | 1996 | 1990.05791062068 | 5.94208937932068 |
| 26 | 1997 | 1989.8295132968 | 7.17048670319807 |
| 27 | 1998 | 1986.77860104054 | 11.2213989594572 |
| 28 | 1999 | 1988.79968690062 | 10.2003130993793 |
| 29 | 2000 | 1990.99174387561 | 9.00825612439363 |
| 30 | 2001 | 1985.75234539676 | 15.2476546032397 |
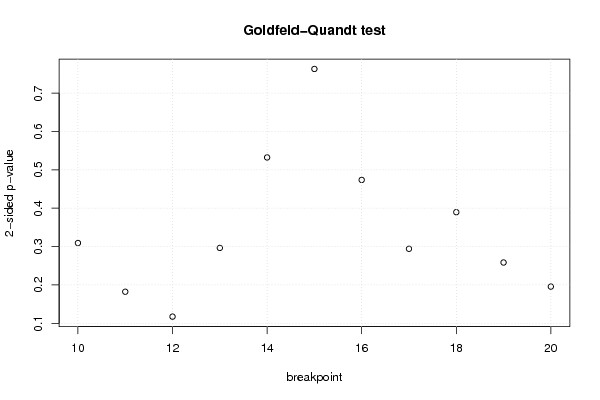
| Goldfeld-Quandt test for Heteroskedasticity | |||
| p-values | Alternative Hypothesis | ||
| breakpoint index | greater | 2-sided | less |
| 10 | 0.154650262403554 | 0.309300524807108 | 0.845349737596446 |
| 11 | 0.0911355253861291 | 0.182271050772258 | 0.908864474613871 |
| 12 | 0.0586364776755932 | 0.117272955351186 | 0.941363522324407 |
| 13 | 0.148219288335678 | 0.296438576671357 | 0.851780711664322 |
| 14 | 0.2661981933191 | 0.532396386638199 | 0.7338018066809 |
| 15 | 0.618411306248796 | 0.763177387502408 | 0.381588693751204 |
| 16 | 0.763099297038176 | 0.473801405923647 | 0.236900702961824 |
| 17 | 0.852911073310999 | 0.294177853378002 | 0.147088926689001 |
| 18 | 0.805176893037041 | 0.389646213925919 | 0.194823106962959 |
| 19 | 0.870775596046067 | 0.258448807907866 | 0.129224403953933 |
| 20 | 0.902201619756873 | 0.195596760486254 | 0.0977983802431272 |
| Meta Analysis of Goldfeld-Quandt test for Heteroskedasticity | |||
| Description | # significant tests | % significant tests | OK/NOK |
| 1% type I error level | 0 | 0 | OK |
| 5% type I error level | 0 | 0 | OK |
| 10% type I error level | 0 | 0 | OK |