| Multiple Linear Regression - Estimated Regression Equation |
| Omzet_product[t] = + 572.83488800214 -0.000146008298080128Uitgaven_voor_promotie[t] -0.630378069393324Prijs_product[t] + 0.450256139727406Gem_budget[t] + 0.0365924346513837Index_cons_vertrouwen[t] -0.0080997935324248uitgave_lok_prom[t] + e[t] |
| Multiple Linear Regression - Ordinary Least Squares | |||||
| Variable | Parameter | S.D. | T-STAT H0: parameter = 0 | 2-tail p-value | 1-tail p-value |
| (Intercept) | 572.83488800214 | 39.595589 | 14.4671 | 0 | 0 |
| Uitgaven_voor_promotie | -0.000146008298080128 | 0.00019 | -0.7666 | 0.45081 | 0.225405 |
| Prijs_product | -0.630378069393324 | 0.188914 | -3.3369 | 0.002753 | 0.001376 |
| Gem_budget | 0.450256139727406 | 0.000389 | 1157.1047 | 0 | 0 |
| Index_cons_vertrouwen | 0.0365924346513837 | 0.08158 | 0.4485 | 0.657782 | 0.328891 |
| uitgave_lok_prom | -0.0080997935324248 | 0.008937 | -0.9063 | 0.373767 | 0.186884 |
| Multiple Linear Regression - Regression Statistics | |
| Multiple R | 0.999992331728976 |
| R-squared | 0.999984663516755 |
| Adjusted R-squared | 0.999981468416079 |
| F-TEST (value) | 312974.383256124 |
| F-TEST (DF numerator) | 5 |
| F-TEST (DF denominator) | 24 |
| p-value | 0 |
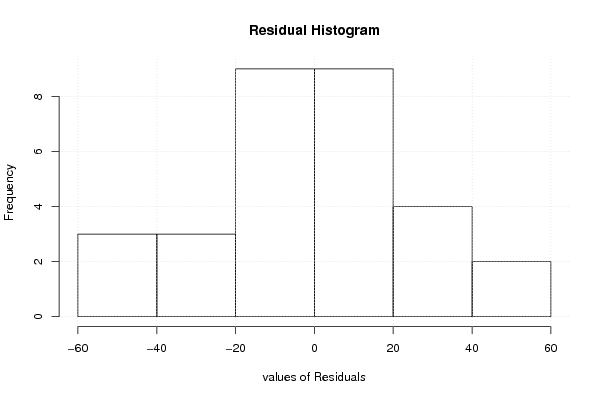
| Multiple Linear Regression - Residual Statistics | |
| Residual Standard Deviation | 28.4532671102599 |
| Sum Squared Residuals | 19430.1218219471 |
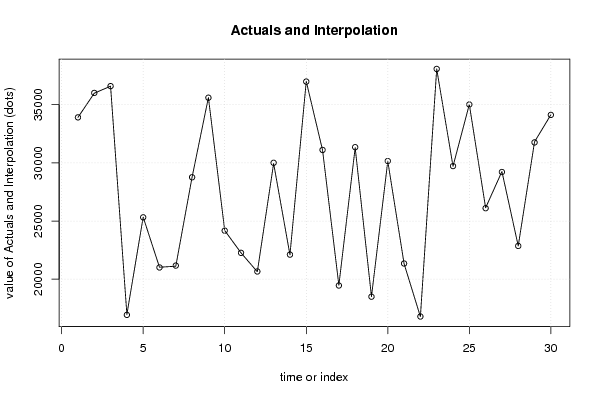
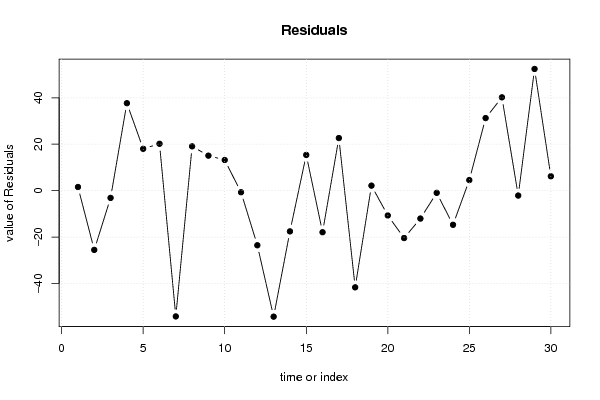
| Multiple Linear Regression - Actuals, Interpolation, and Residuals | |||
| Time or Index | Actuals | Interpolation Forecast | Residuals Prediction Error |
| 1 | 33907 | 33905.4379295097 | 1.56207049032452 |
| 2 | 35981 | 36006.5233704825 | -25.523370482484 |
| 3 | 36588 | 36591.1327598573 | -3.13275985730758 |
| 4 | 16967 | 16929.3423335142 | 37.6576664858072 |
| 5 | 25333 | 25314.9825473449 | 18.0174526551017 |
| 6 | 21027 | 21006.8196682093 | 20.1803317907115 |
| 7 | 21114 | 21168.1865008444 | -54.1865008443737 |
| 8 | 28777 | 28757.9305383585 | 19.0694616414676 |
| 9 | 35612 | 35596.9323101137 | 15.0676898863351 |
| 10 | 24183 | 24169.8042401387 | 13.1957598612586 |
| 11 | 22262 | 22262.6935562304 | -0.693556230366313 |
| 12 | 20637 | 20660.5363198477 | -23.5363198477489 |
| 13 | 29948 | 30002.2872490294 | -54.2872490293551 |
| 14 | 22093 | 22110.5563583762 | -17.5563583762373 |
| 15 | 36997 | 36981.6185811907 | 15.3814188092548 |
| 16 | 31089 | 31106.9257619196 | -17.9257619196433 |
| 17 | 19477 | 19454.3491992479 | 22.6508007521272 |
| 18 | 31301 | 31342.6656590804 | -41.6656590803559 |
| 19 | 18497 | 18494.8532584233 | 2.14674157672846 |
| 20 | 30142 | 30152.6984426177 | -10.6984426176812 |
| 21 | 21326 | 21346.42326735 | -20.4232673500205 |
| 22 | 16779 | 16791.0311509395 | -12.0311509395281 |
| 23 | 38068 | 38068.9558884401 | -0.955888440056607 |
| 24 | 29707 | 29721.7227234828 | -14.7227234827574 |
| 25 | 35016 | 35011.4658072055 | 4.53419279454071 |
| 26 | 26131 | 26099.7598528604 | 31.240147139598 |
| 27 | 29251 | 29210.8230355269 | 40.1769644731229 |
| 28 | 22855 | 22857.1248395458 | -2.12483954579336 |
| 29 | 31806 | 31753.590346311 | 52.409653688992 |
| 30 | 34124 | 34117.8265040017 | 6.17349599833911 |
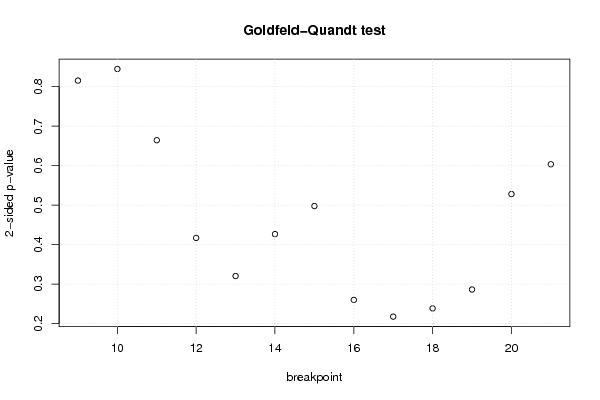
| Goldfeld-Quandt test for Heteroskedasticity | |||
| p-values | Alternative Hypothesis | ||
| breakpoint index | greater | 2-sided | less |
| 9 | 0.592272302228425 | 0.81545539554315 | 0.407727697771575 |
| 10 | 0.422459827869437 | 0.844919655738874 | 0.577540172130563 |
| 11 | 0.332211810088415 | 0.664423620176829 | 0.667788189911586 |
| 12 | 0.208522779663961 | 0.417045559327922 | 0.791477220336039 |
| 13 | 0.839742333248481 | 0.320515333503038 | 0.160257666751519 |
| 14 | 0.786625780334618 | 0.426748439330764 | 0.213374219665382 |
| 15 | 0.751121546976117 | 0.497756906047766 | 0.248878453023883 |
| 16 | 0.86994249236664 | 0.260115015266721 | 0.13005750763336 |
| 17 | 0.891152454275514 | 0.217695091448971 | 0.108847545724486 |
| 18 | 0.880709097725294 | 0.238581804549411 | 0.119290902274706 |
| 19 | 0.85676629729895 | 0.286467405402099 | 0.143233702701049 |
| 20 | 0.735935020458026 | 0.528129959083948 | 0.264064979541974 |
| 21 | 0.69821422518924 | 0.60357154962152 | 0.30178577481076 |
| Meta Analysis of Goldfeld-Quandt test for Heteroskedasticity | |||
| Description | # significant tests | % significant tests | OK/NOK |
| 1% type I error level | 0 | 0 | OK |
| 5% type I error level | 0 | 0 | OK |
| 10% type I error level | 0 | 0 | OK |