| Multiple Linear Regression - Estimated Regression Equation |
| Y[t] = + 571.226537931837 -0.000135648760935602X1[t] -0.647651480072122X2[t] + 0.450211575231433X3[t] + 0.019622941502166X4[t] -0.00826729887996995`X5 `[t] + 0.533659564985225t + e[t] |
| Multiple Linear Regression - Ordinary Least Squares | |||||
| Variable | Parameter | S.D. | T-STAT H0: parameter = 0 | 2-tail p-value | 1-tail p-value |
| (Intercept) | 571.226537931837 | 39.879832 | 14.3237 | 0 | 0 |
| X1 | -0.000135648760935602 | 0.000192 | -0.7065 | 0.486992 | 0.243496 |
| X2 | -0.647651480072122 | 0.191151 | -3.3882 | 0.00253 | 0.001265 |
| X3 | 0.450211575231433 | 0.000395 | 1139.7472 | 0 | 0 |
| X4 | 0.019622941502166 | 0.084496 | 0.2322 | 0.818409 | 0.409205 |
| `X5 ` | -0.00826729887996995 | 0.008993 | -0.9193 | 0.367474 | 0.183737 |
| t | 0.533659564985225 | 0.631924 | 0.8445 | 0.407089 | 0.203544 |
| Multiple Linear Regression - Regression Statistics | |
| Multiple R | 0.999992562355233 |
| R-squared | 0.999985124765785 |
| Adjusted R-squared | 0.999981244269903 |
| F-TEST (value) | 257695.190292208 |
| F-TEST (DF numerator) | 6 |
| F-TEST (DF denominator) | 23 |
| p-value | 0 |
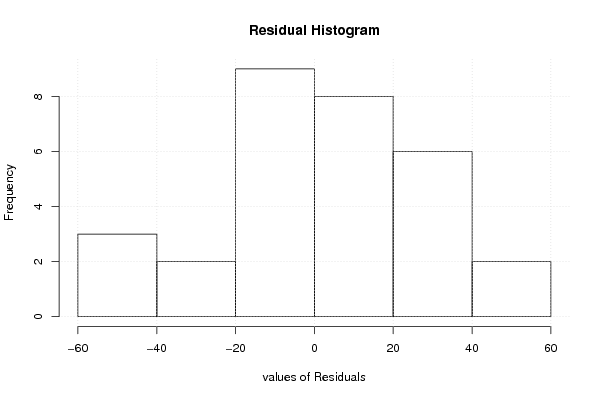
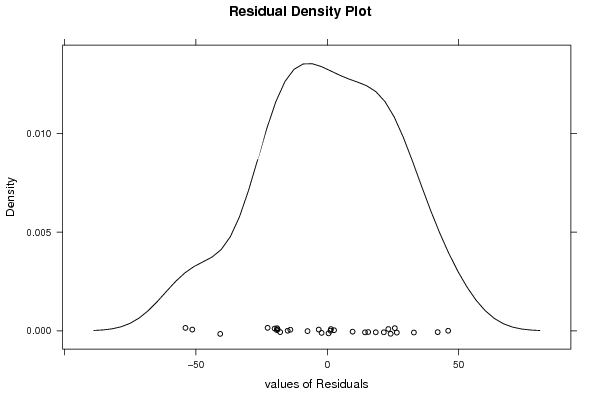
| Multiple Linear Regression - Residual Statistics | |
| Residual Standard Deviation | 28.6248261545836 |
| Sum Squared Residuals | 18845.7554647431 |
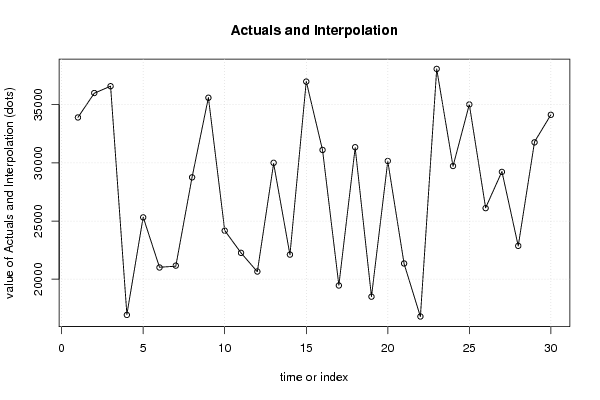
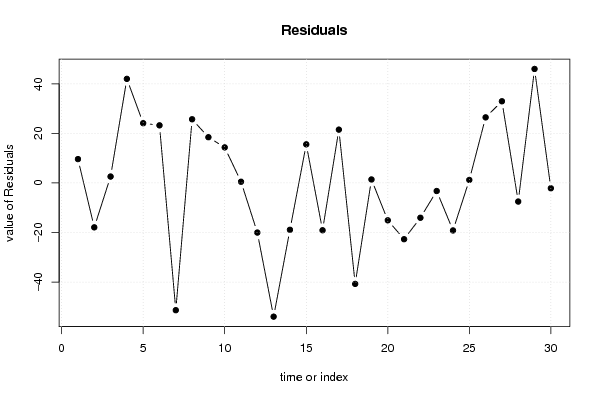
| Multiple Linear Regression - Actuals, Interpolation, and Residuals | |||
| Time or Index | Actuals | Interpolation Forecast | Residuals Prediction Error |
| 1 | 33907 | 33897.3596777405 | 9.64032225952296 |
| 2 | 35981 | 35998.911699792 | -17.9116997919561 |
| 3 | 36588 | 36585.4119880103 | 2.58801198973895 |
| 4 | 16967 | 16924.9793748368 | 42.0206251632287 |
| 5 | 25333 | 25308.8724395952 | 24.127560404757 |
| 6 | 21027 | 21003.7463817704 | 23.2536182296464 |
| 7 | 21114 | 21165.3582248238 | -51.3582248237744 |
| 8 | 28777 | 28751.2886074678 | 25.7113925322473 |
| 9 | 35612 | 35593.5369323211 | 18.4630676788965 |
| 10 | 24183 | 24168.6493000037 | 14.3506999962516 |
| 11 | 22262 | 22261.5008351182 | 0.499164881834414 |
| 12 | 20637 | 20657.0192591705 | -20.0192591705471 |
| 13 | 29948 | 30001.9668628494 | -53.9668628493774 |
| 14 | 22093 | 22111.8940516498 | -18.8940516497632 |
| 15 | 36997 | 36981.4089614716 | 15.5910385284075 |
| 16 | 31089 | 31108.0939613519 | -19.0939613519105 |
| 17 | 19477 | 19455.4694736393 | 21.5305263606565 |
| 18 | 31301 | 31341.7415776267 | -40.741577626661 |
| 19 | 18497 | 18495.5966069799 | 1.40339302007732 |
| 20 | 30142 | 30157.0786648927 | -15.078664892678 |
| 21 | 21326 | 21348.7069476537 | -22.7069476537025 |
| 22 | 16779 | 16793.0404714474 | -14.040471447379 |
| 23 | 38068 | 38071.2495266592 | -3.24952665924025 |
| 24 | 29707 | 29726.1715794707 | -19.1715794707365 |
| 25 | 35016 | 35014.7732271573 | 1.2267728427052 |
| 26 | 26131 | 26104.5260078524 | 26.4739921475895 |
| 27 | 29251 | 29218.0197758763 | 32.9802241236629 |
| 28 | 22855 | 22862.5044290525 | -7.50442905250101 |
| 29 | 31806 | 31759.9739233731 | 46.0260766269491 |
| 30 | 34124 | 34126.1492303459 | -2.1492303459448 |
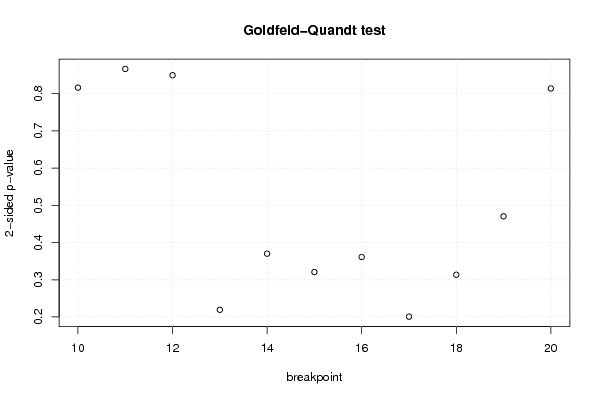
| Goldfeld-Quandt test for Heteroskedasticity | |||
| p-values | Alternative Hypothesis | ||
| breakpoint index | greater | 2-sided | less |
| 10 | 0.591799221867261 | 0.816401556265478 | 0.408200778132739 |
| 11 | 0.566683106762187 | 0.866633786475626 | 0.433316893237813 |
| 12 | 0.424909005950841 | 0.849818011901682 | 0.575090994049159 |
| 13 | 0.890365589268825 | 0.219268821462351 | 0.109634410731175 |
| 14 | 0.814930966778472 | 0.370138066443055 | 0.185069033221528 |
| 15 | 0.839596585327416 | 0.320806829345167 | 0.160403414672584 |
| 16 | 0.819414223314403 | 0.361171553371194 | 0.180585776685597 |
| 17 | 0.899558068355158 | 0.200883863289684 | 0.100441931644842 |
| 18 | 0.843244828374196 | 0.313510343251609 | 0.156755171625804 |
| 19 | 0.764698962629217 | 0.470602074741567 | 0.235301037370783 |
| 20 | 0.592937233595439 | 0.814125532809122 | 0.407062766404561 |
| Meta Analysis of Goldfeld-Quandt test for Heteroskedasticity | |||
| Description | # significant tests | % significant tests | OK/NOK |
| 1% type I error level | 0 | 0 | OK |
| 5% type I error level | 0 | 0 | OK |
| 10% type I error level | 0 | 0 | OK |