| Multiple Linear Regression - Estimated Regression Equation |
| Y_t[t] = -0.187358145378251 + 0.000331876523507789X_1t[t] + 0.00144758264854112X_2t[t] + 0.456273556485971X_3t[t] + 0.000383387024625746X_4t[t] -0.00015911681280923X_5t[t] + e[t] |
| Multiple Linear Regression - Ordinary Least Squares | |||||
| Variable | Parameter | S.D. | T-STAT H0: parameter = 0 | 2-tail p-value | 1-tail p-value |
| (Intercept) | -0.187358145378251 | 0.433319 | -0.4324 | 0.669326 | 0.334663 |
| X_1t | 0.000331876523507789 | 0.000519 | 0.6396 | 0.528514 | 0.264257 |
| X_2t | 0.00144758264854112 | 0.001937 | 0.7473 | 0.462153 | 0.231076 |
| X_3t | 0.456273556485971 | 0.003896 | 117.1233 | 0 | 0 |
| X_4t | 0.000383387024625746 | 0.000813 | 0.4713 | 0.641678 | 0.320839 |
| X_5t | -0.00015911681280923 | 0.000173 | -0.92 | 0.366719 | 0.183359 |
| Multiple Linear Regression - Regression Statistics | |
| Multiple R | 0.999257578304255 |
| R-squared | 0.998515707798483 |
| Adjusted R-squared | 0.9982064802565 |
| F-TEST (value) | 3229.06459559325 |
| F-TEST (DF numerator) | 5 |
| F-TEST (DF denominator) | 24 |
| p-value | 0 |
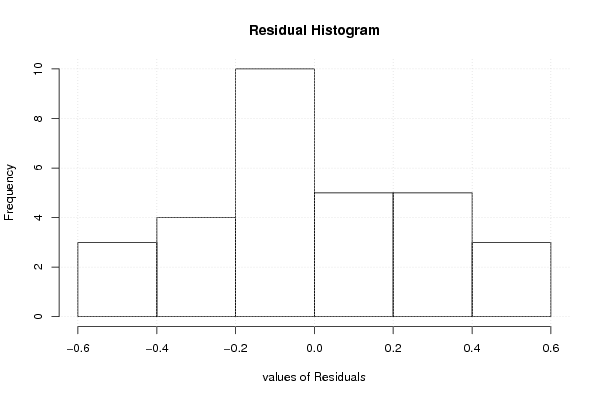
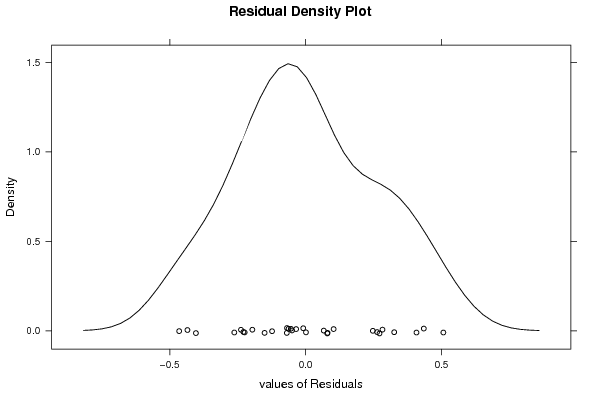
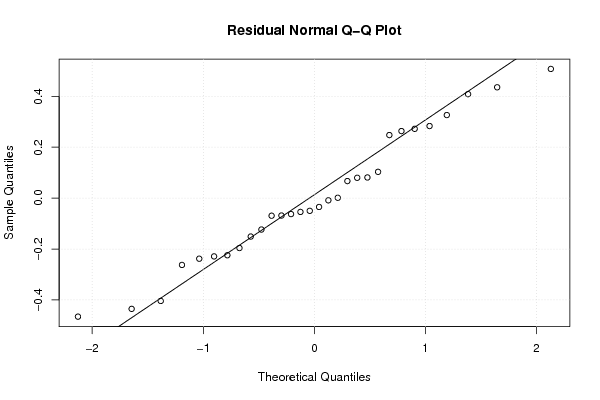
| Multiple Linear Regression - Residual Statistics | |
| Residual Standard Deviation | 0.283271046221723 |
| Sum Squared Residuals | 1.9258196550612 |
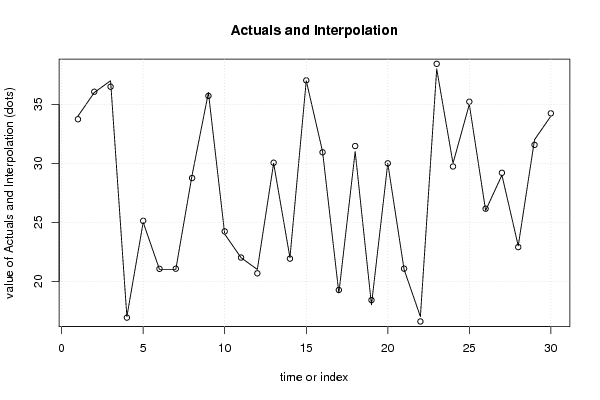
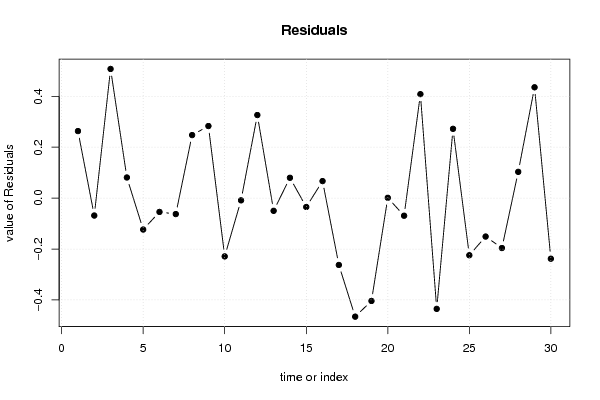
| Multiple Linear Regression - Actuals, Interpolation, and Residuals | |||
| Time or Index | Actuals | Interpolation Forecast | Residuals Prediction Error |
| 1 | 34 | 33.7367117839698 | 0.263288216030209 |
| 2 | 36 | 36.0683992538277 | -0.068399253827721 |
| 3 | 37 | 36.4928020371123 | 0.507197962887703 |
| 4 | 17 | 16.9189272561321 | 0.0810727438678629 |
| 5 | 25 | 25.1233731631316 | -0.123373163131633 |
| 6 | 21 | 21.054217116964 | -0.0542171169640256 |
| 7 | 21 | 21.0626316719109 | -0.0626316719108542 |
| 8 | 29 | 28.7524287586606 | 0.247571241339359 |
| 9 | 36 | 35.7169220669053 | 0.283077933094736 |
| 10 | 24 | 24.2288441730085 | -0.228844173008505 |
| 11 | 22 | 22.0086589365306 | -0.00865893653059613 |
| 12 | 21 | 20.6737785795072 | 0.326221420492843 |
| 13 | 30 | 30.0498993170141 | -0.0498993170141071 |
| 14 | 22 | 21.9201314362483 | 0.0798685637517401 |
| 15 | 37 | 37.0347860082792 | -0.0347860082792011 |
| 16 | 31 | 30.9331220867945 | 0.0668779132054991 |
| 17 | 19 | 19.2624196935567 | -0.262419693556652 |
| 18 | 31 | 31.4654031534266 | -0.465403153426588 |
| 19 | 18 | 18.4036971469088 | -0.403697146908821 |
| 20 | 30 | 29.9986088906636 | 0.00139110933643514 |
| 21 | 21 | 21.0691046884935 | -0.0691046884934589 |
| 22 | 17 | 16.5917721173103 | 0.408227882689664 |
| 23 | 38 | 38.4348360356437 | -0.434836035643678 |
| 24 | 30 | 29.7279070378323 | 0.272092962167685 |
| 25 | 35 | 35.2242556596721 | -0.224255659672146 |
| 26 | 26 | 26.1508811633847 | -0.150881163384722 |
| 27 | 29 | 29.1959251894967 | -0.195925189496733 |
| 28 | 23 | 22.8968199012985 | 0.103180098701535 |
| 29 | 32 | 31.5648055283436 | 0.435194471656432 |
| 30 | 34 | 34.2379301479723 | -0.237930147972263 |
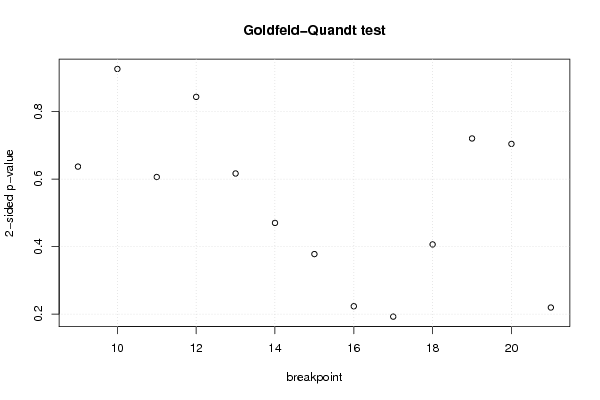
| Goldfeld-Quandt test for Heteroskedasticity | |||
| p-values | Alternative Hypothesis | ||
| breakpoint index | greater | 2-sided | less |
| 9 | 0.318464790045139 | 0.636929580090278 | 0.681535209954861 |
| 10 | 0.463151657928709 | 0.926303315857417 | 0.536848342071291 |
| 11 | 0.303027489920949 | 0.606054979841898 | 0.696972510079051 |
| 12 | 0.421727386161545 | 0.84345477232309 | 0.578272613838455 |
| 13 | 0.308249017692138 | 0.616498035384275 | 0.691750982307862 |
| 14 | 0.234960941172282 | 0.469921882344563 | 0.765039058827718 |
| 15 | 0.188801091781526 | 0.377602183563052 | 0.811198908218474 |
| 16 | 0.111531156716533 | 0.223062313433067 | 0.888468843283467 |
| 17 | 0.0961235558840794 | 0.192247111768159 | 0.90387644411592 |
| 18 | 0.203130856158211 | 0.406261712316423 | 0.796869143841789 |
| 19 | 0.639839683486058 | 0.720320633027884 | 0.360160316513942 |
| 20 | 0.647896874545044 | 0.704206250909913 | 0.352103125454957 |
| 21 | 0.890350176107103 | 0.219299647785794 | 0.109649823892897 |
| Meta Analysis of Goldfeld-Quandt test for Heteroskedasticity | |||
| Description | # significant tests | % significant tests | OK/NOK |
| 1% type I error level | 0 | 0 | OK |
| 5% type I error level | 0 | 0 | OK |
| 10% type I error level | 0 | 0 | OK |