| Multiple Linear Regression - Estimated Regression Equation |
| x1[t] = + 12.2662551669423 + 0.00739161503025132x2[t] + 0.0005837156555437x3[t] -0.330230236582663x4[t] -0.00946288487507264x5[t] + e[t] |
| Multiple Linear Regression - Ordinary Least Squares | |||||
| Variable | Parameter | S.D. | T-STAT H0: parameter = 0 | 2-tail p-value | 1-tail p-value |
| (Intercept) | 12.2662551669423 | 2.020147 | 6.072 | 0 | 0 |
| x2 | 0.00739161503025132 | 0.006934 | 1.0661 | 0.291734 | 0.145867 |
| x3 | 0.0005837156555437 | 0.000722 | 0.8086 | 0.422753 | 0.211377 |
| x4 | -0.330230236582663 | 0.234552 | -1.4079 | 0.165598 | 0.082799 |
| x5 | -0.00946288487507264 | 0.004887 | -1.9364 | 0.058717 | 0.029358 |
| Multiple Linear Regression - Regression Statistics | |
| Multiple R | 0.379083047311434 |
| R-squared | 0.143703956758923 |
| Adjusted R-squared | 0.0723459531555002 |
| F-TEST (value) | 2.01384497186283 |
| F-TEST (DF numerator) | 4 |
| F-TEST (DF denominator) | 48 |
| p-value | 0.107455004361819 |
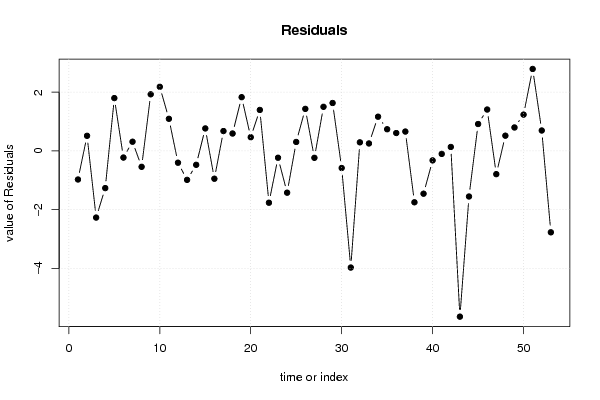
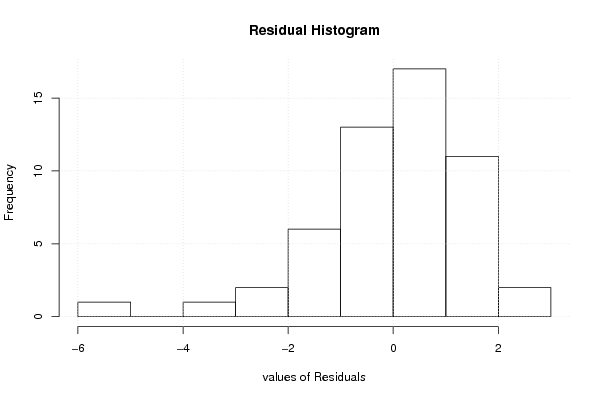
| Multiple Linear Regression - Residual Statistics | |
| Residual Standard Deviation | 1.60126238508799 |
| Sum Squared Residuals | 123.073978843088 |
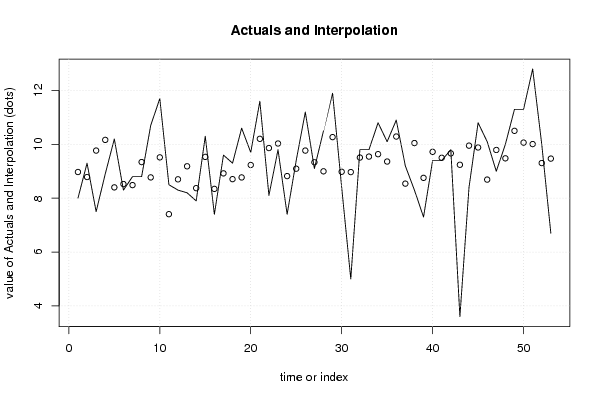
| Multiple Linear Regression - Actuals, Interpolation, and Residuals | |||
| Time or Index | Actuals | Interpolation Forecast | Residuals Prediction Error |
| 1 | 8 | 8.97202665537339 | -0.97202665537339 |
| 2 | 9.300000191 | 8.78597545064412 | 0.51402474035588 |
| 3 | 7.5 | 9.76807045730224 | -2.26807045730224 |
| 4 | 8.899999619 | 10.1649198519307 | -1.26492023293067 |
| 5 | 10.19999981 | 8.40140173590016 | 1.79859807409984 |
| 6 | 8.300000191 | 8.52512232483443 | -0.225122133834433 |
| 7 | 8.800000191 | 8.48642186230376 | 0.313578328696236 |
| 8 | 8.800000191 | 9.34120702046856 | -0.541206829468555 |
| 9 | 10.69999981 | 8.77197432364066 | 1.92802548635934 |
| 10 | 11.69999981 | 9.51640829033323 | 2.18359151966676 |
| 11 | 8.5 | 7.40628138374007 | 1.09371861625993 |
| 12 | 8.300000191 | 8.70058817818893 | -0.400587987188927 |
| 13 | 8.199999809 | 9.18521908988633 | -0.985219280886326 |
| 14 | 7.900000095 | 8.37230745994745 | -0.472307364947453 |
| 15 | 10.30000019 | 9.53387891649835 | 0.766121273501653 |
| 16 | 7.400000095 | 8.34570685024772 | -0.945706755247721 |
| 17 | 9.600000381 | 8.92288837636184 | 0.677112004638156 |
| 18 | 9.300000191 | 8.70695703262182 | 0.593043158378185 |
| 19 | 10.60000038 | 8.77036442089465 | 1.82963595910535 |
| 20 | 9.699999809 | 9.23300720335764 | 0.466992605642356 |
| 21 | 11.60000038 | 10.2047358254756 | 1.39526455452438 |
| 22 | 8.100000381 | 9.8625882200543 | -1.7625878390543 |
| 23 | 9.800000191 | 10.0311742199176 | -0.231174028917586 |
| 24 | 7.400000095 | 8.82078611594752 | -1.42078602094752 |
| 25 | 9.399999619 | 9.09470394411474 | 0.305295674885261 |
| 26 | 11.19999981 | 9.76803577475672 | 1.43196403524328 |
| 27 | 9.100000381 | 9.33399006963647 | -0.233989688636476 |
| 28 | 10.5 | 8.99810271619316 | 1.50189728380684 |
| 29 | 11.89999962 | 10.2680262882624 | 1.63197333173758 |
| 30 | 8.399999619 | 8.98121238985572 | -0.581212770855718 |
| 31 | 5 | 8.96948730635205 | -3.96948730635205 |
| 32 | 9.800000191 | 9.50775190565569 | 0.292248285344308 |
| 33 | 9.800000191 | 9.54535484170044 | 0.254645349299557 |
| 34 | 10.80000019 | 9.63475526718102 | 1.16524492281898 |
| 35 | 10.10000038 | 9.36153393830083 | 0.738466441699168 |
| 36 | 10.89999962 | 10.2900942141976 | 0.609905405802424 |
| 37 | 9.199999809 | 8.54019535178266 | 0.659804457217337 |
| 38 | 8.300000191 | 10.0478169924589 | -1.74781680145892 |
| 39 | 7.300000191 | 8.75542268206579 | -1.45542249106579 |
| 40 | 9.399999619 | 9.72189488979475 | -0.321895270794744 |
| 41 | 9.399999619 | 9.50067315307057 | -0.10067353407057 |
| 42 | 9.800000191 | 9.66447590239719 | 0.135524288602814 |
| 43 | 3.599999905 | 9.24040974054532 | -5.64040983554532 |
| 44 | 8.399999619 | 9.95069516680641 | -1.55069554780641 |
| 45 | 10.80000019 | 9.8835612581701 | 0.916438931829899 |
| 46 | 10.10000038 | 8.69060905795837 | 1.40939132204163 |
| 47 | 9 | 9.79037539189222 | -0.790375391892218 |
| 48 | 10 | 9.48117937801253 | 0.518820621987475 |
| 49 | 11.30000019 | 10.5017292099824 | 0.79827098001764 |
| 50 | 11.30000019 | 10.0638896066784 | 1.23611058332162 |
| 51 | 12.80000019 | 10.0093598651099 | 2.79064032489013 |
| 52 | 10 | 9.30479142463087 | 0.695208575369128 |
| 53 | 6.699999809 | 9.4698627215658 | -2.7698629125658 |
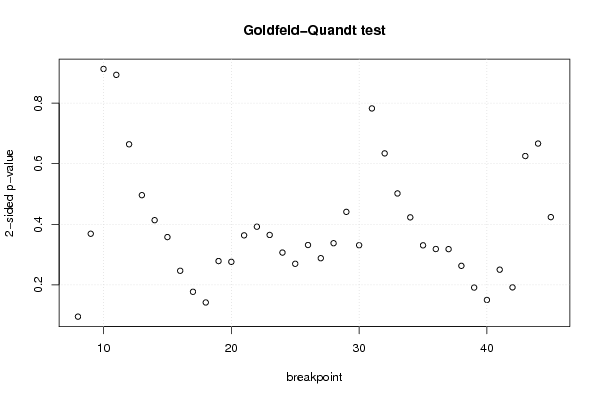
| Goldfeld-Quandt test for Heteroskedasticity | |||
| p-values | Alternative Hypothesis | ||
| breakpoint index | greater | 2-sided | less |
| 8 | 0.047355382592969 | 0.0947107651859379 | 0.952644617407031 |
| 9 | 0.184318860787197 | 0.368637721574395 | 0.815681139212803 |
| 10 | 0.456542321059515 | 0.91308464211903 | 0.543457678940485 |
| 11 | 0.446800652785577 | 0.893601305571153 | 0.553199347214423 |
| 12 | 0.332082883733873 | 0.664165767467745 | 0.667917116266127 |
| 13 | 0.248000681360964 | 0.496001362721929 | 0.751999318639036 |
| 14 | 0.206725426181044 | 0.413450852362087 | 0.793274573818956 |
| 15 | 0.178799229751228 | 0.357598459502456 | 0.821200770248772 |
| 16 | 0.123153959520348 | 0.246307919040696 | 0.876846040479652 |
| 17 | 0.0884439860502595 | 0.176887972100519 | 0.91155601394974 |
| 18 | 0.0707876071194108 | 0.141575214238822 | 0.929212392880589 |
| 19 | 0.13920768978113 | 0.278415379562259 | 0.86079231021887 |
| 20 | 0.137916709962615 | 0.27583341992523 | 0.862083290037385 |
| 21 | 0.181657720468494 | 0.363315440936988 | 0.818342279531506 |
| 22 | 0.195926137112799 | 0.391852274225599 | 0.804073862887201 |
| 23 | 0.182345043219856 | 0.364690086439711 | 0.817654956780144 |
| 24 | 0.153209605806007 | 0.306419211612014 | 0.846790394193993 |
| 25 | 0.134699957584158 | 0.269399915168316 | 0.865300042415842 |
| 26 | 0.165692584534905 | 0.33138516906981 | 0.834307415465095 |
| 27 | 0.143930953388227 | 0.287861906776453 | 0.856069046611774 |
| 28 | 0.168671795072083 | 0.337343590144165 | 0.831328204927917 |
| 29 | 0.220469570733862 | 0.440939141467724 | 0.779530429266138 |
| 30 | 0.16535668634319 | 0.33071337268638 | 0.83464331365681 |
| 31 | 0.391314853624548 | 0.782629707249095 | 0.608685146375452 |
| 32 | 0.317061574752158 | 0.634123149504316 | 0.682938425247842 |
| 33 | 0.250879786147044 | 0.501759572294087 | 0.749120213852956 |
| 34 | 0.211400369687695 | 0.42280073937539 | 0.788599630312305 |
| 35 | 0.165184659874056 | 0.330369319748112 | 0.834815340125944 |
| 36 | 0.159096700854752 | 0.318193401709504 | 0.840903299145248 |
| 37 | 0.158864397184553 | 0.317728794369107 | 0.841135602815447 |
| 38 | 0.131296178937304 | 0.262592357874609 | 0.868703821062696 |
| 39 | 0.0954163490551875 | 0.190832698110375 | 0.904583650944813 |
| 40 | 0.0749176467845392 | 0.149835293569078 | 0.925082353215461 |
| 41 | 0.124932119998985 | 0.249864239997971 | 0.875067880001015 |
| 42 | 0.0957703763748789 | 0.191540752749758 | 0.904229623625121 |
| 43 | 0.312682773275941 | 0.625365546551883 | 0.687317226724059 |
| 44 | 0.333287418281879 | 0.666574836563758 | 0.666712581718121 |
| 45 | 0.211761949553625 | 0.42352389910725 | 0.788238050446375 |
| Meta Analysis of Goldfeld-Quandt test for Heteroskedasticity | |||
| Description | # significant tests | % significant tests | OK/NOK |
| 1% type I error level | 0 | 0 | OK |
| 5% type I error level | 0 | 0 | OK |
| 10% type I error level | 1 | 0.0263157894736842 | OK |