Free Statistics

of Irreproducible Research!

Author's title

Author*Unverified author*
R Software Modulerwasp_autocorrelation.wasp
Title produced by software(Partial) Autocorrelation Function
Date of computationFri, 18 Nov 2011 06:52:43 -0500
Cite this page as followsStatistical Computations at FreeStatistics.org, Office for Research Development and Education, URL https://freestatistics.org/blog/index.php?v=date/2011/Nov/18/t1321617275thrct6uuwe6taou.htm/, Retrieved Tue, 16 Apr 2024 10:18:56 +0000
Statistical Computations at FreeStatistics.org, Office for Research Development and Education, URL https://freestatistics.org/blog/index.php?pk=145442, Retrieved Tue, 16 Apr 2024 10:18:56 +0000
QR Codes:

Original text written by user:
IsPrivate?No (this computation is public)
User-defined keywordsKDGP2W12
Estimated Impact112
Family? (F = Feedback message, R = changed R code, M = changed R Module, P = changed Parameters, D = changed Data)
-       [(Partial) Autocorrelation Function] [Correlatie gem. p...] [2011-11-18 11:52:43] [a207ad521877ea2910ca3b39cbf26b1e] [Current]
Feedback Forum

Post a new message
Dataseries X:
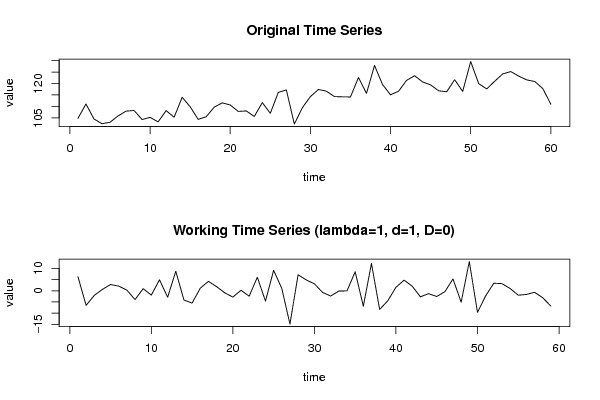
104.77
111.04
104.5
102.42
103.05
105.84
107.92
108.22
104.26
105.19
103.25
108.16
105.27
113.99
109.84
104.33
105.48
109.68
111.54
110.63
107.8
108.02
105.59
111.64
107
116.14
117.18
102.28
109.43
114.28
117.39
116.66
114.29
114.18
114.12
122.62
115.7
127.91
119.55
115.08
116.63
121.38
123.41
120.7
119.4
116.83
116.4
121.67
116.54
129.61
119.93
117.64
121.01
124.2
125.23
123.24
121.58
120.89
117.77
110.91


Summary of computational transaction
Raw Inputview raw input (R code)
Raw Outputview raw output of R engine
Computing time2 seconds
R Server'Gwilym Jenkins' @ jenkins.wessa.net

\begin{tabular}{lllllllll}
\hline
Summary of computational transaction \tabularnewline
Raw Input & view raw input (R code)  \tabularnewline
Raw Output & view raw output of R engine  \tabularnewline
Computing time & 2 seconds \tabularnewline
R Server & 'Gwilym Jenkins' @ jenkins.wessa.net \tabularnewline
\hline
\end{tabular}
%Source: https://freestatistics.org/blog/index.php?pk=145442&T=0

[TABLE]
[ROW][C]Summary of computational transaction[/C][/ROW]
[ROW][C]Raw Input[/C][C]view raw input (R code) [/C][/ROW]
[ROW][C]Raw Output[/C][C]view raw output of R engine [/C][/ROW]
[ROW][C]Computing time[/C][C]2 seconds[/C][/ROW]
[ROW][C]R Server[/C][C]'Gwilym Jenkins' @ jenkins.wessa.net[/C][/ROW]
[/TABLE]
Source: https://freestatistics.org/blog/index.php?pk=145442&T=0

Globally Unique Identifier (entire table): ba.freestatistics.org/blog/index.php?pk=145442&T=0

As an alternative you can also use a QR Code:  

The GUIDs for individual cells are displayed in the table below:

Summary of computational transaction
Raw Inputview raw input (R code)
Raw Outputview raw output of R engine
Computing time2 seconds
R Server'Gwilym Jenkins' @ jenkins.wessa.net


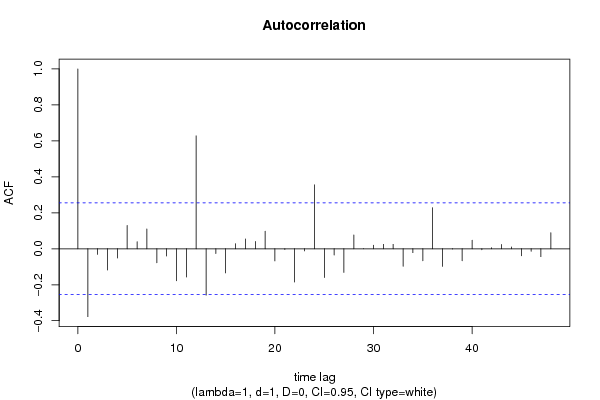
Autocorrelation Function
Time lag kACF(k)T-STATP-value
1-0.377296-2.89810.002632
2-0.030925-0.23750.40653
3-0.118161-0.90760.183887
4-0.051387-0.39470.347238
50.1297530.99670.161502
60.0392410.30140.38208
70.1099270.84440.200938
8-0.077295-0.59370.277486
9-0.039701-0.30490.380739
10-0.177795-1.36570.088613
11-0.156487-1.2020.117083
120.6277814.82215e-06
13-0.257752-1.97980.026197
14-0.026177-0.20110.420667
15-0.134127-1.03030.153548
160.0283070.21740.414312
170.054590.41930.338256
180.0403880.31020.378743
190.0979220.75220.227474
20-0.067408-0.51780.303277
21-0.004125-0.03170.487415
22-0.184542-1.41750.0808
23-0.011463-0.08810.465067
240.3554932.73060.004161
25-0.159805-1.22750.112258
26-0.034922-0.26820.394723
27-0.131088-1.00690.159046
280.0765920.58830.279282
29-0.000699-0.00540.497866
300.0199990.15360.439219
310.0245830.18880.425439
320.0247160.18980.425041
33-0.097423-0.74830.228619
34-0.021369-0.16410.43509
35-0.066174-0.50830.306571
360.2281641.75260.042436
37-0.097997-0.75270.227303
38-0.00136-0.01040.495849
39-0.066871-0.51360.304709
400.0476950.36640.357707
41-0.00564-0.04330.482796
420.0055650.04270.483023
430.0243230.18680.426217
440.0105080.08070.467972
45-0.038873-0.29860.38315
46-0.014074-0.10810.45714
47-0.043768-0.33620.368962
480.08930.68590.247723

\begin{tabular}{lllllllll}
\hline
Autocorrelation Function \tabularnewline
Time lag k & ACF(k) & T-STAT & P-value \tabularnewline
1 & -0.377296 & -2.8981 & 0.002632 \tabularnewline
2 & -0.030925 & -0.2375 & 0.40653 \tabularnewline
3 & -0.118161 & -0.9076 & 0.183887 \tabularnewline
4 & -0.051387 & -0.3947 & 0.347238 \tabularnewline
5 & 0.129753 & 0.9967 & 0.161502 \tabularnewline
6 & 0.039241 & 0.3014 & 0.38208 \tabularnewline
7 & 0.109927 & 0.8444 & 0.200938 \tabularnewline
8 & -0.077295 & -0.5937 & 0.277486 \tabularnewline
9 & -0.039701 & -0.3049 & 0.380739 \tabularnewline
10 & -0.177795 & -1.3657 & 0.088613 \tabularnewline
11 & -0.156487 & -1.202 & 0.117083 \tabularnewline
12 & 0.627781 & 4.8221 & 5e-06 \tabularnewline
13 & -0.257752 & -1.9798 & 0.026197 \tabularnewline
14 & -0.026177 & -0.2011 & 0.420667 \tabularnewline
15 & -0.134127 & -1.0303 & 0.153548 \tabularnewline
16 & 0.028307 & 0.2174 & 0.414312 \tabularnewline
17 & 0.05459 & 0.4193 & 0.338256 \tabularnewline
18 & 0.040388 & 0.3102 & 0.378743 \tabularnewline
19 & 0.097922 & 0.7522 & 0.227474 \tabularnewline
20 & -0.067408 & -0.5178 & 0.303277 \tabularnewline
21 & -0.004125 & -0.0317 & 0.487415 \tabularnewline
22 & -0.184542 & -1.4175 & 0.0808 \tabularnewline
23 & -0.011463 & -0.0881 & 0.465067 \tabularnewline
24 & 0.355493 & 2.7306 & 0.004161 \tabularnewline
25 & -0.159805 & -1.2275 & 0.112258 \tabularnewline
26 & -0.034922 & -0.2682 & 0.394723 \tabularnewline
27 & -0.131088 & -1.0069 & 0.159046 \tabularnewline
28 & 0.076592 & 0.5883 & 0.279282 \tabularnewline
29 & -0.000699 & -0.0054 & 0.497866 \tabularnewline
30 & 0.019999 & 0.1536 & 0.439219 \tabularnewline
31 & 0.024583 & 0.1888 & 0.425439 \tabularnewline
32 & 0.024716 & 0.1898 & 0.425041 \tabularnewline
33 & -0.097423 & -0.7483 & 0.228619 \tabularnewline
34 & -0.021369 & -0.1641 & 0.43509 \tabularnewline
35 & -0.066174 & -0.5083 & 0.306571 \tabularnewline
36 & 0.228164 & 1.7526 & 0.042436 \tabularnewline
37 & -0.097997 & -0.7527 & 0.227303 \tabularnewline
38 & -0.00136 & -0.0104 & 0.495849 \tabularnewline
39 & -0.066871 & -0.5136 & 0.304709 \tabularnewline
40 & 0.047695 & 0.3664 & 0.357707 \tabularnewline
41 & -0.00564 & -0.0433 & 0.482796 \tabularnewline
42 & 0.005565 & 0.0427 & 0.483023 \tabularnewline
43 & 0.024323 & 0.1868 & 0.426217 \tabularnewline
44 & 0.010508 & 0.0807 & 0.467972 \tabularnewline
45 & -0.038873 & -0.2986 & 0.38315 \tabularnewline
46 & -0.014074 & -0.1081 & 0.45714 \tabularnewline
47 & -0.043768 & -0.3362 & 0.368962 \tabularnewline
48 & 0.0893 & 0.6859 & 0.247723 \tabularnewline
\hline
\end{tabular}
%Source: https://freestatistics.org/blog/index.php?pk=145442&T=1

[TABLE]
[ROW][C]Autocorrelation Function[/C][/ROW]
[ROW][C]Time lag k[/C][C]ACF(k)[/C][C]T-STAT[/C][C]P-value[/C][/ROW]
[ROW][C]1[/C][C]-0.377296[/C][C]-2.8981[/C][C]0.002632[/C][/ROW]
[ROW][C]2[/C][C]-0.030925[/C][C]-0.2375[/C][C]0.40653[/C][/ROW]
[ROW][C]3[/C][C]-0.118161[/C][C]-0.9076[/C][C]0.183887[/C][/ROW]
[ROW][C]4[/C][C]-0.051387[/C][C]-0.3947[/C][C]0.347238[/C][/ROW]
[ROW][C]5[/C][C]0.129753[/C][C]0.9967[/C][C]0.161502[/C][/ROW]
[ROW][C]6[/C][C]0.039241[/C][C]0.3014[/C][C]0.38208[/C][/ROW]
[ROW][C]7[/C][C]0.109927[/C][C]0.8444[/C][C]0.200938[/C][/ROW]
[ROW][C]8[/C][C]-0.077295[/C][C]-0.5937[/C][C]0.277486[/C][/ROW]
[ROW][C]9[/C][C]-0.039701[/C][C]-0.3049[/C][C]0.380739[/C][/ROW]
[ROW][C]10[/C][C]-0.177795[/C][C]-1.3657[/C][C]0.088613[/C][/ROW]
[ROW][C]11[/C][C]-0.156487[/C][C]-1.202[/C][C]0.117083[/C][/ROW]
[ROW][C]12[/C][C]0.627781[/C][C]4.8221[/C][C]5e-06[/C][/ROW]
[ROW][C]13[/C][C]-0.257752[/C][C]-1.9798[/C][C]0.026197[/C][/ROW]
[ROW][C]14[/C][C]-0.026177[/C][C]-0.2011[/C][C]0.420667[/C][/ROW]
[ROW][C]15[/C][C]-0.134127[/C][C]-1.0303[/C][C]0.153548[/C][/ROW]
[ROW][C]16[/C][C]0.028307[/C][C]0.2174[/C][C]0.414312[/C][/ROW]
[ROW][C]17[/C][C]0.05459[/C][C]0.4193[/C][C]0.338256[/C][/ROW]
[ROW][C]18[/C][C]0.040388[/C][C]0.3102[/C][C]0.378743[/C][/ROW]
[ROW][C]19[/C][C]0.097922[/C][C]0.7522[/C][C]0.227474[/C][/ROW]
[ROW][C]20[/C][C]-0.067408[/C][C]-0.5178[/C][C]0.303277[/C][/ROW]
[ROW][C]21[/C][C]-0.004125[/C][C]-0.0317[/C][C]0.487415[/C][/ROW]
[ROW][C]22[/C][C]-0.184542[/C][C]-1.4175[/C][C]0.0808[/C][/ROW]
[ROW][C]23[/C][C]-0.011463[/C][C]-0.0881[/C][C]0.465067[/C][/ROW]
[ROW][C]24[/C][C]0.355493[/C][C]2.7306[/C][C]0.004161[/C][/ROW]
[ROW][C]25[/C][C]-0.159805[/C][C]-1.2275[/C][C]0.112258[/C][/ROW]
[ROW][C]26[/C][C]-0.034922[/C][C]-0.2682[/C][C]0.394723[/C][/ROW]
[ROW][C]27[/C][C]-0.131088[/C][C]-1.0069[/C][C]0.159046[/C][/ROW]
[ROW][C]28[/C][C]0.076592[/C][C]0.5883[/C][C]0.279282[/C][/ROW]
[ROW][C]29[/C][C]-0.000699[/C][C]-0.0054[/C][C]0.497866[/C][/ROW]
[ROW][C]30[/C][C]0.019999[/C][C]0.1536[/C][C]0.439219[/C][/ROW]
[ROW][C]31[/C][C]0.024583[/C][C]0.1888[/C][C]0.425439[/C][/ROW]
[ROW][C]32[/C][C]0.024716[/C][C]0.1898[/C][C]0.425041[/C][/ROW]
[ROW][C]33[/C][C]-0.097423[/C][C]-0.7483[/C][C]0.228619[/C][/ROW]
[ROW][C]34[/C][C]-0.021369[/C][C]-0.1641[/C][C]0.43509[/C][/ROW]
[ROW][C]35[/C][C]-0.066174[/C][C]-0.5083[/C][C]0.306571[/C][/ROW]
[ROW][C]36[/C][C]0.228164[/C][C]1.7526[/C][C]0.042436[/C][/ROW]
[ROW][C]37[/C][C]-0.097997[/C][C]-0.7527[/C][C]0.227303[/C][/ROW]
[ROW][C]38[/C][C]-0.00136[/C][C]-0.0104[/C][C]0.495849[/C][/ROW]
[ROW][C]39[/C][C]-0.066871[/C][C]-0.5136[/C][C]0.304709[/C][/ROW]
[ROW][C]40[/C][C]0.047695[/C][C]0.3664[/C][C]0.357707[/C][/ROW]
[ROW][C]41[/C][C]-0.00564[/C][C]-0.0433[/C][C]0.482796[/C][/ROW]
[ROW][C]42[/C][C]0.005565[/C][C]0.0427[/C][C]0.483023[/C][/ROW]
[ROW][C]43[/C][C]0.024323[/C][C]0.1868[/C][C]0.426217[/C][/ROW]
[ROW][C]44[/C][C]0.010508[/C][C]0.0807[/C][C]0.467972[/C][/ROW]
[ROW][C]45[/C][C]-0.038873[/C][C]-0.2986[/C][C]0.38315[/C][/ROW]
[ROW][C]46[/C][C]-0.014074[/C][C]-0.1081[/C][C]0.45714[/C][/ROW]
[ROW][C]47[/C][C]-0.043768[/C][C]-0.3362[/C][C]0.368962[/C][/ROW]
[ROW][C]48[/C][C]0.0893[/C][C]0.6859[/C][C]0.247723[/C][/ROW]
[/TABLE]
Source: https://freestatistics.org/blog/index.php?pk=145442&T=1

Globally Unique Identifier (entire table): ba.freestatistics.org/blog/index.php?pk=145442&T=1

As an alternative you can also use a QR Code:  

The GUIDs for individual cells are displayed in the table below:

Autocorrelation Function
Time lag kACF(k)T-STATP-value
1-0.377296-2.89810.002632
2-0.030925-0.23750.40653
3-0.118161-0.90760.183887
4-0.051387-0.39470.347238
50.1297530.99670.161502
60.0392410.30140.38208
70.1099270.84440.200938
8-0.077295-0.59370.277486
9-0.039701-0.30490.380739
10-0.177795-1.36570.088613
11-0.156487-1.2020.117083
120.6277814.82215e-06
13-0.257752-1.97980.026197
14-0.026177-0.20110.420667
15-0.134127-1.03030.153548
160.0283070.21740.414312
170.054590.41930.338256
180.0403880.31020.378743
190.0979220.75220.227474
20-0.067408-0.51780.303277
21-0.004125-0.03170.487415
22-0.184542-1.41750.0808
23-0.011463-0.08810.465067
240.3554932.73060.004161
25-0.159805-1.22750.112258
26-0.034922-0.26820.394723
27-0.131088-1.00690.159046
280.0765920.58830.279282
29-0.000699-0.00540.497866
300.0199990.15360.439219
310.0245830.18880.425439
320.0247160.18980.425041
33-0.097423-0.74830.228619
34-0.021369-0.16410.43509
35-0.066174-0.50830.306571
360.2281641.75260.042436
37-0.097997-0.75270.227303
38-0.00136-0.01040.495849
39-0.066871-0.51360.304709
400.0476950.36640.357707
41-0.00564-0.04330.482796
420.0055650.04270.483023
430.0243230.18680.426217
440.0105080.08070.467972
45-0.038873-0.29860.38315
46-0.014074-0.10810.45714
47-0.043768-0.33620.368962
480.08930.68590.247723


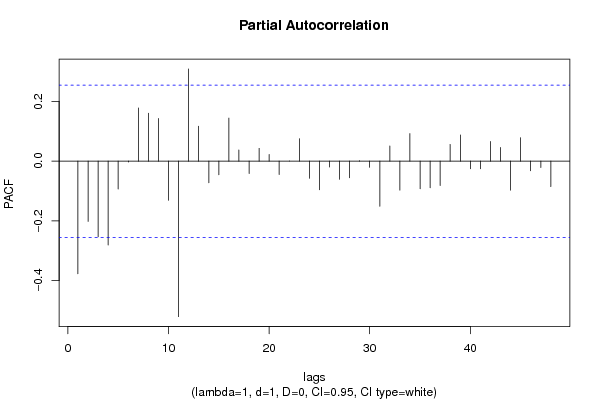
Partial Autocorrelation Function
Time lag kPACF(k)T-STATP-value
1-0.377296-2.89810.002632
2-0.202037-1.55190.06302
3-0.253348-1.9460.028211
4-0.281115-2.15930.017452
5-0.093238-0.71620.238354
6-0.002981-0.02290.490903
70.1779341.36670.088447
80.1607211.23450.110952
90.1432151.10010.137888
10-0.13101-1.00630.15919
11-0.521373-4.00478.8e-05
120.3091082.37430.010427
130.1167620.89690.186717
14-0.072527-0.55710.289787
15-0.045464-0.34920.364085
160.144241.10790.136194
170.0373790.28710.387515
18-0.041239-0.31680.37627
190.0429390.32980.371353
200.0223810.17190.432047
21-0.044873-0.34470.365782
22-0.000149-0.00110.499547
230.0753580.57880.282453
24-0.057169-0.43910.331089
25-0.095842-0.73620.232271
26-0.019575-0.15040.440496
27-0.060857-0.46750.320949
28-0.055515-0.42640.335678
290.001530.01170.495333
30-0.020421-0.15690.437945
31-0.151188-1.16130.125099
320.0509670.39150.348424
33-0.097176-0.74640.229187
340.0923440.70930.240464
35-0.092752-0.71240.239501
36-0.089104-0.68440.248196
37-0.081637-0.62710.266518
380.0561540.43130.3339
390.0874360.67160.252228
40-0.025262-0.1940.423405
41-0.025273-0.19410.423372
420.0660170.50710.306992
430.045890.35250.362865
44-0.097147-0.74620.229255
450.0785730.60350.274235
46-0.032145-0.24690.402917
47-0.021491-0.16510.434724
48-0.085336-0.65550.257354

\begin{tabular}{lllllllll}
\hline
Partial Autocorrelation Function \tabularnewline
Time lag k & PACF(k) & T-STAT & P-value \tabularnewline
1 & -0.377296 & -2.8981 & 0.002632 \tabularnewline
2 & -0.202037 & -1.5519 & 0.06302 \tabularnewline
3 & -0.253348 & -1.946 & 0.028211 \tabularnewline
4 & -0.281115 & -2.1593 & 0.017452 \tabularnewline
5 & -0.093238 & -0.7162 & 0.238354 \tabularnewline
6 & -0.002981 & -0.0229 & 0.490903 \tabularnewline
7 & 0.177934 & 1.3667 & 0.088447 \tabularnewline
8 & 0.160721 & 1.2345 & 0.110952 \tabularnewline
9 & 0.143215 & 1.1001 & 0.137888 \tabularnewline
10 & -0.13101 & -1.0063 & 0.15919 \tabularnewline
11 & -0.521373 & -4.0047 & 8.8e-05 \tabularnewline
12 & 0.309108 & 2.3743 & 0.010427 \tabularnewline
13 & 0.116762 & 0.8969 & 0.186717 \tabularnewline
14 & -0.072527 & -0.5571 & 0.289787 \tabularnewline
15 & -0.045464 & -0.3492 & 0.364085 \tabularnewline
16 & 0.14424 & 1.1079 & 0.136194 \tabularnewline
17 & 0.037379 & 0.2871 & 0.387515 \tabularnewline
18 & -0.041239 & -0.3168 & 0.37627 \tabularnewline
19 & 0.042939 & 0.3298 & 0.371353 \tabularnewline
20 & 0.022381 & 0.1719 & 0.432047 \tabularnewline
21 & -0.044873 & -0.3447 & 0.365782 \tabularnewline
22 & -0.000149 & -0.0011 & 0.499547 \tabularnewline
23 & 0.075358 & 0.5788 & 0.282453 \tabularnewline
24 & -0.057169 & -0.4391 & 0.331089 \tabularnewline
25 & -0.095842 & -0.7362 & 0.232271 \tabularnewline
26 & -0.019575 & -0.1504 & 0.440496 \tabularnewline
27 & -0.060857 & -0.4675 & 0.320949 \tabularnewline
28 & -0.055515 & -0.4264 & 0.335678 \tabularnewline
29 & 0.00153 & 0.0117 & 0.495333 \tabularnewline
30 & -0.020421 & -0.1569 & 0.437945 \tabularnewline
31 & -0.151188 & -1.1613 & 0.125099 \tabularnewline
32 & 0.050967 & 0.3915 & 0.348424 \tabularnewline
33 & -0.097176 & -0.7464 & 0.229187 \tabularnewline
34 & 0.092344 & 0.7093 & 0.240464 \tabularnewline
35 & -0.092752 & -0.7124 & 0.239501 \tabularnewline
36 & -0.089104 & -0.6844 & 0.248196 \tabularnewline
37 & -0.081637 & -0.6271 & 0.266518 \tabularnewline
38 & 0.056154 & 0.4313 & 0.3339 \tabularnewline
39 & 0.087436 & 0.6716 & 0.252228 \tabularnewline
40 & -0.025262 & -0.194 & 0.423405 \tabularnewline
41 & -0.025273 & -0.1941 & 0.423372 \tabularnewline
42 & 0.066017 & 0.5071 & 0.306992 \tabularnewline
43 & 0.04589 & 0.3525 & 0.362865 \tabularnewline
44 & -0.097147 & -0.7462 & 0.229255 \tabularnewline
45 & 0.078573 & 0.6035 & 0.274235 \tabularnewline
46 & -0.032145 & -0.2469 & 0.402917 \tabularnewline
47 & -0.021491 & -0.1651 & 0.434724 \tabularnewline
48 & -0.085336 & -0.6555 & 0.257354 \tabularnewline
\hline
\end{tabular}
%Source: https://freestatistics.org/blog/index.php?pk=145442&T=2

[TABLE]
[ROW][C]Partial Autocorrelation Function[/C][/ROW]
[ROW][C]Time lag k[/C][C]PACF(k)[/C][C]T-STAT[/C][C]P-value[/C][/ROW]
[ROW][C]1[/C][C]-0.377296[/C][C]-2.8981[/C][C]0.002632[/C][/ROW]
[ROW][C]2[/C][C]-0.202037[/C][C]-1.5519[/C][C]0.06302[/C][/ROW]
[ROW][C]3[/C][C]-0.253348[/C][C]-1.946[/C][C]0.028211[/C][/ROW]
[ROW][C]4[/C][C]-0.281115[/C][C]-2.1593[/C][C]0.017452[/C][/ROW]
[ROW][C]5[/C][C]-0.093238[/C][C]-0.7162[/C][C]0.238354[/C][/ROW]
[ROW][C]6[/C][C]-0.002981[/C][C]-0.0229[/C][C]0.490903[/C][/ROW]
[ROW][C]7[/C][C]0.177934[/C][C]1.3667[/C][C]0.088447[/C][/ROW]
[ROW][C]8[/C][C]0.160721[/C][C]1.2345[/C][C]0.110952[/C][/ROW]
[ROW][C]9[/C][C]0.143215[/C][C]1.1001[/C][C]0.137888[/C][/ROW]
[ROW][C]10[/C][C]-0.13101[/C][C]-1.0063[/C][C]0.15919[/C][/ROW]
[ROW][C]11[/C][C]-0.521373[/C][C]-4.0047[/C][C]8.8e-05[/C][/ROW]
[ROW][C]12[/C][C]0.309108[/C][C]2.3743[/C][C]0.010427[/C][/ROW]
[ROW][C]13[/C][C]0.116762[/C][C]0.8969[/C][C]0.186717[/C][/ROW]
[ROW][C]14[/C][C]-0.072527[/C][C]-0.5571[/C][C]0.289787[/C][/ROW]
[ROW][C]15[/C][C]-0.045464[/C][C]-0.3492[/C][C]0.364085[/C][/ROW]
[ROW][C]16[/C][C]0.14424[/C][C]1.1079[/C][C]0.136194[/C][/ROW]
[ROW][C]17[/C][C]0.037379[/C][C]0.2871[/C][C]0.387515[/C][/ROW]
[ROW][C]18[/C][C]-0.041239[/C][C]-0.3168[/C][C]0.37627[/C][/ROW]
[ROW][C]19[/C][C]0.042939[/C][C]0.3298[/C][C]0.371353[/C][/ROW]
[ROW][C]20[/C][C]0.022381[/C][C]0.1719[/C][C]0.432047[/C][/ROW]
[ROW][C]21[/C][C]-0.044873[/C][C]-0.3447[/C][C]0.365782[/C][/ROW]
[ROW][C]22[/C][C]-0.000149[/C][C]-0.0011[/C][C]0.499547[/C][/ROW]
[ROW][C]23[/C][C]0.075358[/C][C]0.5788[/C][C]0.282453[/C][/ROW]
[ROW][C]24[/C][C]-0.057169[/C][C]-0.4391[/C][C]0.331089[/C][/ROW]
[ROW][C]25[/C][C]-0.095842[/C][C]-0.7362[/C][C]0.232271[/C][/ROW]
[ROW][C]26[/C][C]-0.019575[/C][C]-0.1504[/C][C]0.440496[/C][/ROW]
[ROW][C]27[/C][C]-0.060857[/C][C]-0.4675[/C][C]0.320949[/C][/ROW]
[ROW][C]28[/C][C]-0.055515[/C][C]-0.4264[/C][C]0.335678[/C][/ROW]
[ROW][C]29[/C][C]0.00153[/C][C]0.0117[/C][C]0.495333[/C][/ROW]
[ROW][C]30[/C][C]-0.020421[/C][C]-0.1569[/C][C]0.437945[/C][/ROW]
[ROW][C]31[/C][C]-0.151188[/C][C]-1.1613[/C][C]0.125099[/C][/ROW]
[ROW][C]32[/C][C]0.050967[/C][C]0.3915[/C][C]0.348424[/C][/ROW]
[ROW][C]33[/C][C]-0.097176[/C][C]-0.7464[/C][C]0.229187[/C][/ROW]
[ROW][C]34[/C][C]0.092344[/C][C]0.7093[/C][C]0.240464[/C][/ROW]
[ROW][C]35[/C][C]-0.092752[/C][C]-0.7124[/C][C]0.239501[/C][/ROW]
[ROW][C]36[/C][C]-0.089104[/C][C]-0.6844[/C][C]0.248196[/C][/ROW]
[ROW][C]37[/C][C]-0.081637[/C][C]-0.6271[/C][C]0.266518[/C][/ROW]
[ROW][C]38[/C][C]0.056154[/C][C]0.4313[/C][C]0.3339[/C][/ROW]
[ROW][C]39[/C][C]0.087436[/C][C]0.6716[/C][C]0.252228[/C][/ROW]
[ROW][C]40[/C][C]-0.025262[/C][C]-0.194[/C][C]0.423405[/C][/ROW]
[ROW][C]41[/C][C]-0.025273[/C][C]-0.1941[/C][C]0.423372[/C][/ROW]
[ROW][C]42[/C][C]0.066017[/C][C]0.5071[/C][C]0.306992[/C][/ROW]
[ROW][C]43[/C][C]0.04589[/C][C]0.3525[/C][C]0.362865[/C][/ROW]
[ROW][C]44[/C][C]-0.097147[/C][C]-0.7462[/C][C]0.229255[/C][/ROW]
[ROW][C]45[/C][C]0.078573[/C][C]0.6035[/C][C]0.274235[/C][/ROW]
[ROW][C]46[/C][C]-0.032145[/C][C]-0.2469[/C][C]0.402917[/C][/ROW]
[ROW][C]47[/C][C]-0.021491[/C][C]-0.1651[/C][C]0.434724[/C][/ROW]
[ROW][C]48[/C][C]-0.085336[/C][C]-0.6555[/C][C]0.257354[/C][/ROW]
[/TABLE]
Source: https://freestatistics.org/blog/index.php?pk=145442&T=2

Globally Unique Identifier (entire table): ba.freestatistics.org/blog/index.php?pk=145442&T=2

As an alternative you can also use a QR Code:  

The GUIDs for individual cells are displayed in the table below:

Partial Autocorrelation Function
Time lag kPACF(k)T-STATP-value
1-0.377296-2.89810.002632
2-0.202037-1.55190.06302
3-0.253348-1.9460.028211
4-0.281115-2.15930.017452
5-0.093238-0.71620.238354
6-0.002981-0.02290.490903
70.1779341.36670.088447
80.1607211.23450.110952
90.1432151.10010.137888
10-0.13101-1.00630.15919
11-0.521373-4.00478.8e-05
120.3091082.37430.010427
130.1167620.89690.186717
14-0.072527-0.55710.289787
15-0.045464-0.34920.364085
160.144241.10790.136194
170.0373790.28710.387515
18-0.041239-0.31680.37627
190.0429390.32980.371353
200.0223810.17190.432047
21-0.044873-0.34470.365782
22-0.000149-0.00110.499547
230.0753580.57880.282453
24-0.057169-0.43910.331089
25-0.095842-0.73620.232271
26-0.019575-0.15040.440496
27-0.060857-0.46750.320949
28-0.055515-0.42640.335678
290.001530.01170.495333
30-0.020421-0.15690.437945
31-0.151188-1.16130.125099
320.0509670.39150.348424
33-0.097176-0.74640.229187
340.0923440.70930.240464
35-0.092752-0.71240.239501
36-0.089104-0.68440.248196
37-0.081637-0.62710.266518
380.0561540.43130.3339
390.0874360.67160.252228
40-0.025262-0.1940.423405
41-0.025273-0.19410.423372
420.0660170.50710.306992
430.045890.35250.362865
44-0.097147-0.74620.229255
450.0785730.60350.274235
46-0.032145-0.24690.402917
47-0.021491-0.16510.434724
48-0.085336-0.65550.257354


Parameters (Session):
par1 = 48 ; par2 = 1 ; par3 = 1 ; par4 = 0 ; par5 = 12 ; par6 = White Noise ; par7 = 0.95 ;
Parameters (R input):
par1 = 48 ; par2 = 1 ; par3 = 1 ; par4 = 0 ; par5 = 12 ; par6 = White Noise ; par7 = 0.95 ; par8 = ;
R code (references can be found in the software module):
if (par1 == 'Default') {
par1 = 10*log10(length(x))
} else {
par1 <- as.numeric(par1)
}
par2 <- as.numeric(par2)
par3 <- as.numeric(par3)
par4 <- as.numeric(par4)
par5 <- as.numeric(par5)
if (par6 == 'White Noise') par6 <- 'white' else par6 <- 'ma'
par7 <- as.numeric(par7)
if (par8 != '') par8 <- as.numeric(par8)
ox <- x
if (par8 == '') {
if (par2 == 0) {
x <- log(x)
} else {
x <- (x ^ par2 - 1) / par2
}
} else {
x <- log(x,base=par8)
}
if (par3 > 0) x <- diff(x,lag=1,difference=par3)
if (par4 > 0) x <- diff(x,lag=par5,difference=par4)
bitmap(file='picts.png')
op <- par(mfrow=c(2,1))
plot(ox,type='l',main='Original Time Series',xlab='time',ylab='value')
if (par8=='') {
mytitle <- paste('Working Time Series (lambda=',par2,', d=',par3,', D=',par4,')',sep='')
mysub <- paste('(lambda=',par2,', d=',par3,', D=',par4,', CI=', par7, ', CI type=',par6,')',sep='')
} else {
mytitle <- paste('Working Time Series (base=',par8,', d=',par3,', D=',par4,')',sep='')
mysub <- paste('(base=',par8,', d=',par3,', D=',par4,', CI=', par7, ', CI type=',par6,')',sep='')
}
plot(x,type='l', main=mytitle,xlab='time',ylab='value')
par(op)
dev.off()
bitmap(file='pic1.png')
racf <- acf(x, par1, main='Autocorrelation', xlab='time lag', ylab='ACF', ci.type=par6, ci=par7, sub=mysub)
dev.off()
bitmap(file='pic2.png')
rpacf <- pacf(x,par1,main='Partial Autocorrelation',xlab='lags',ylab='PACF',sub=mysub)
dev.off()
(myacf <- c(racf$acf))
(mypacf <- c(rpacf$acf))
lengthx <- length(x)
sqrtn <- sqrt(lengthx)
load(file='createtable')
a<-table.start()
a<-table.row.start(a)
a<-table.element(a,'Autocorrelation Function',4,TRUE)
a<-table.row.end(a)
a<-table.row.start(a)
a<-table.element(a,'Time lag k',header=TRUE)
a<-table.element(a,hyperlink('basics.htm','ACF(k)','click here for more information about the Autocorrelation Function'),header=TRUE)
a<-table.element(a,'T-STAT',header=TRUE)
a<-table.element(a,'P-value',header=TRUE)
a<-table.row.end(a)
for (i in 2:(par1+1)) {
a<-table.row.start(a)
a<-table.element(a,i-1,header=TRUE)
a<-table.element(a,round(myacf[i],6))
mytstat <- myacf[i]*sqrtn
a<-table.element(a,round(mytstat,4))
a<-table.element(a,round(1-pt(abs(mytstat),lengthx),6))
a<-table.row.end(a)
}
a<-table.end(a)
table.save(a,file='mytable.tab')
a<-table.start()
a<-table.row.start(a)
a<-table.element(a,'Partial Autocorrelation Function',4,TRUE)
a<-table.row.end(a)
a<-table.row.start(a)
a<-table.element(a,'Time lag k',header=TRUE)
a<-table.element(a,hyperlink('basics.htm','PACF(k)','click here for more information about the Partial Autocorrelation Function'),header=TRUE)
a<-table.element(a,'T-STAT',header=TRUE)
a<-table.element(a,'P-value',header=TRUE)
a<-table.row.end(a)
for (i in 1:par1) {
a<-table.row.start(a)
a<-table.element(a,i,header=TRUE)
a<-table.element(a,round(mypacf[i],6))
mytstat <- mypacf[i]*sqrtn
a<-table.element(a,round(mytstat,4))
a<-table.element(a,round(1-pt(abs(mytstat),lengthx),6))
a<-table.row.end(a)
}
a<-table.end(a)
table.save(a,file='mytable1.tab')