Free Statistics

of Irreproducible Research!

Author's title

Author*Unverified author*
R Software Modulerwasp_autocorrelation.wasp
Title produced by software(Partial) Autocorrelation Function
Date of computationFri, 18 Nov 2011 06:46:59 -0500
Cite this page as followsStatistical Computations at FreeStatistics.org, Office for Research Development and Education, URL https://freestatistics.org/blog/index.php?v=date/2011/Nov/18/t1321616955szsyddedkntmdgr.htm/, Retrieved Fri, 19 Apr 2024 08:46:29 +0000
Statistical Computations at FreeStatistics.org, Office for Research Development and Education, URL https://freestatistics.org/blog/index.php?pk=145440, Retrieved Fri, 19 Apr 2024 08:46:29 +0000
QR Codes:

Original text written by user:
IsPrivate?No (this computation is public)
User-defined keywordsKDGP2W12
Estimated Impact133
Family? (F = Feedback message, R = changed R code, M = changed R Module, P = changed Parameters, D = changed Data)
-       [(Partial) Autocorrelation Function] [Correlatie gem. p...] [2011-11-18 11:46:59] [a207ad521877ea2910ca3b39cbf26b1e] [Current]
Feedback Forum

Post a new message
Dataseries X:
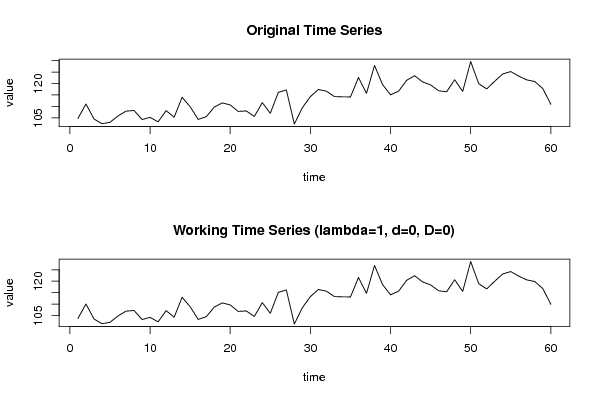
104.77
111.04
104.5
102.42
103.05
105.84
107.92
108.22
104.26
105.19
103.25
108.16
105.27
113.99
109.84
104.33
105.48
109.68
111.54
110.63
107.8
108.02
105.59
111.64
107
116.14
117.18
102.28
109.43
114.28
117.39
116.66
114.29
114.18
114.12
122.62
115.7
127.91
119.55
115.08
116.63
121.38
123.41
120.7
119.4
116.83
116.4
121.67
116.54
129.61
119.93
117.64
121.01
124.2
125.23
123.24
121.58
120.89
117.77
110.91


Summary of computational transaction
Raw Inputview raw input (R code)
Raw Outputview raw output of R engine
Computing time2 seconds
R Server'Gwilym Jenkins' @ jenkins.wessa.net

\begin{tabular}{lllllllll}
\hline
Summary of computational transaction \tabularnewline
Raw Input & view raw input (R code)  \tabularnewline
Raw Output & view raw output of R engine  \tabularnewline
Computing time & 2 seconds \tabularnewline
R Server & 'Gwilym Jenkins' @ jenkins.wessa.net \tabularnewline
\hline
\end{tabular}
%Source: https://freestatistics.org/blog/index.php?pk=145440&T=0

[TABLE]
[ROW][C]Summary of computational transaction[/C][/ROW]
[ROW][C]Raw Input[/C][C]view raw input (R code) [/C][/ROW]
[ROW][C]Raw Output[/C][C]view raw output of R engine [/C][/ROW]
[ROW][C]Computing time[/C][C]2 seconds[/C][/ROW]
[ROW][C]R Server[/C][C]'Gwilym Jenkins' @ jenkins.wessa.net[/C][/ROW]
[/TABLE]
Source: https://freestatistics.org/blog/index.php?pk=145440&T=0

Globally Unique Identifier (entire table): ba.freestatistics.org/blog/index.php?pk=145440&T=0

As an alternative you can also use a QR Code:  

The GUIDs for individual cells are displayed in the table below:

Summary of computational transaction
Raw Inputview raw input (R code)
Raw Outputview raw output of R engine
Computing time2 seconds
R Server'Gwilym Jenkins' @ jenkins.wessa.net


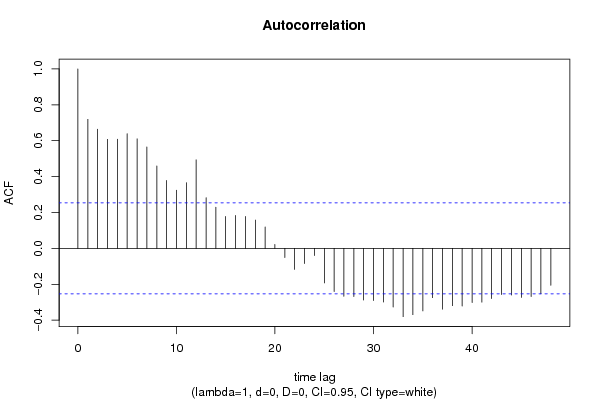
Autocorrelation Function
Time lag kACF(k)T-STATP-value
10.7188855.56850
20.6637365.14132e-06
30.6077584.70778e-06
40.6084334.71297e-06
50.6392024.95123e-06
60.61044.72817e-06
70.5653884.37952.4e-05
80.4592673.55750.000369
90.3787762.9340.002367
100.3238172.50830.007427
110.3658252.83370.00313
120.4933723.82160.000159
130.2820382.18470.016416
140.2291171.77470.040507
150.1777841.37710.086797
160.1831681.41880.080564
170.1775521.37530.087075
180.1574611.21970.113678
190.1191350.92280.179899
200.0211980.16420.435064
21-0.051111-0.39590.34679
22-0.116862-0.90520.184487
23-0.084661-0.65580.257237
24-0.03983-0.30850.379377
25-0.192448-1.49070.07064
26-0.240469-1.86270.033703
27-0.2667-2.06590.021584
28-0.268267-2.0780.020998
29-0.287299-2.22540.014912
30-0.290927-2.25350.013947
31-0.298778-2.31430.012045
32-0.326309-2.52760.007069
33-0.380503-2.94740.00228
34-0.369428-2.86160.002897
35-0.348319-2.69810.004522
36-0.274565-2.12680.01878
37-0.338771-2.62410.005501
38-0.319124-2.47190.008146
39-0.32132-2.48890.007802
40-0.301412-2.33470.011461
41-0.299544-2.32030.011873
42-0.279361-2.16390.017231
43-0.257459-1.99430.025336
44-0.260201-2.01550.024169
45-0.273151-2.11580.01926
46-0.26788-2.0750.021142
47-0.252606-1.95670.027522
48-0.205945-1.59520.057956

\begin{tabular}{lllllllll}
\hline
Autocorrelation Function \tabularnewline
Time lag k & ACF(k) & T-STAT & P-value \tabularnewline
1 & 0.718885 & 5.5685 & 0 \tabularnewline
2 & 0.663736 & 5.1413 & 2e-06 \tabularnewline
3 & 0.607758 & 4.7077 & 8e-06 \tabularnewline
4 & 0.608433 & 4.7129 & 7e-06 \tabularnewline
5 & 0.639202 & 4.9512 & 3e-06 \tabularnewline
6 & 0.6104 & 4.7281 & 7e-06 \tabularnewline
7 & 0.565388 & 4.3795 & 2.4e-05 \tabularnewline
8 & 0.459267 & 3.5575 & 0.000369 \tabularnewline
9 & 0.378776 & 2.934 & 0.002367 \tabularnewline
10 & 0.323817 & 2.5083 & 0.007427 \tabularnewline
11 & 0.365825 & 2.8337 & 0.00313 \tabularnewline
12 & 0.493372 & 3.8216 & 0.000159 \tabularnewline
13 & 0.282038 & 2.1847 & 0.016416 \tabularnewline
14 & 0.229117 & 1.7747 & 0.040507 \tabularnewline
15 & 0.177784 & 1.3771 & 0.086797 \tabularnewline
16 & 0.183168 & 1.4188 & 0.080564 \tabularnewline
17 & 0.177552 & 1.3753 & 0.087075 \tabularnewline
18 & 0.157461 & 1.2197 & 0.113678 \tabularnewline
19 & 0.119135 & 0.9228 & 0.179899 \tabularnewline
20 & 0.021198 & 0.1642 & 0.435064 \tabularnewline
21 & -0.051111 & -0.3959 & 0.34679 \tabularnewline
22 & -0.116862 & -0.9052 & 0.184487 \tabularnewline
23 & -0.084661 & -0.6558 & 0.257237 \tabularnewline
24 & -0.03983 & -0.3085 & 0.379377 \tabularnewline
25 & -0.192448 & -1.4907 & 0.07064 \tabularnewline
26 & -0.240469 & -1.8627 & 0.033703 \tabularnewline
27 & -0.2667 & -2.0659 & 0.021584 \tabularnewline
28 & -0.268267 & -2.078 & 0.020998 \tabularnewline
29 & -0.287299 & -2.2254 & 0.014912 \tabularnewline
30 & -0.290927 & -2.2535 & 0.013947 \tabularnewline
31 & -0.298778 & -2.3143 & 0.012045 \tabularnewline
32 & -0.326309 & -2.5276 & 0.007069 \tabularnewline
33 & -0.380503 & -2.9474 & 0.00228 \tabularnewline
34 & -0.369428 & -2.8616 & 0.002897 \tabularnewline
35 & -0.348319 & -2.6981 & 0.004522 \tabularnewline
36 & -0.274565 & -2.1268 & 0.01878 \tabularnewline
37 & -0.338771 & -2.6241 & 0.005501 \tabularnewline
38 & -0.319124 & -2.4719 & 0.008146 \tabularnewline
39 & -0.32132 & -2.4889 & 0.007802 \tabularnewline
40 & -0.301412 & -2.3347 & 0.011461 \tabularnewline
41 & -0.299544 & -2.3203 & 0.011873 \tabularnewline
42 & -0.279361 & -2.1639 & 0.017231 \tabularnewline
43 & -0.257459 & -1.9943 & 0.025336 \tabularnewline
44 & -0.260201 & -2.0155 & 0.024169 \tabularnewline
45 & -0.273151 & -2.1158 & 0.01926 \tabularnewline
46 & -0.26788 & -2.075 & 0.021142 \tabularnewline
47 & -0.252606 & -1.9567 & 0.027522 \tabularnewline
48 & -0.205945 & -1.5952 & 0.057956 \tabularnewline
\hline
\end{tabular}
%Source: https://freestatistics.org/blog/index.php?pk=145440&T=1

[TABLE]
[ROW][C]Autocorrelation Function[/C][/ROW]
[ROW][C]Time lag k[/C][C]ACF(k)[/C][C]T-STAT[/C][C]P-value[/C][/ROW]
[ROW][C]1[/C][C]0.718885[/C][C]5.5685[/C][C]0[/C][/ROW]
[ROW][C]2[/C][C]0.663736[/C][C]5.1413[/C][C]2e-06[/C][/ROW]
[ROW][C]3[/C][C]0.607758[/C][C]4.7077[/C][C]8e-06[/C][/ROW]
[ROW][C]4[/C][C]0.608433[/C][C]4.7129[/C][C]7e-06[/C][/ROW]
[ROW][C]5[/C][C]0.639202[/C][C]4.9512[/C][C]3e-06[/C][/ROW]
[ROW][C]6[/C][C]0.6104[/C][C]4.7281[/C][C]7e-06[/C][/ROW]
[ROW][C]7[/C][C]0.565388[/C][C]4.3795[/C][C]2.4e-05[/C][/ROW]
[ROW][C]8[/C][C]0.459267[/C][C]3.5575[/C][C]0.000369[/C][/ROW]
[ROW][C]9[/C][C]0.378776[/C][C]2.934[/C][C]0.002367[/C][/ROW]
[ROW][C]10[/C][C]0.323817[/C][C]2.5083[/C][C]0.007427[/C][/ROW]
[ROW][C]11[/C][C]0.365825[/C][C]2.8337[/C][C]0.00313[/C][/ROW]
[ROW][C]12[/C][C]0.493372[/C][C]3.8216[/C][C]0.000159[/C][/ROW]
[ROW][C]13[/C][C]0.282038[/C][C]2.1847[/C][C]0.016416[/C][/ROW]
[ROW][C]14[/C][C]0.229117[/C][C]1.7747[/C][C]0.040507[/C][/ROW]
[ROW][C]15[/C][C]0.177784[/C][C]1.3771[/C][C]0.086797[/C][/ROW]
[ROW][C]16[/C][C]0.183168[/C][C]1.4188[/C][C]0.080564[/C][/ROW]
[ROW][C]17[/C][C]0.177552[/C][C]1.3753[/C][C]0.087075[/C][/ROW]
[ROW][C]18[/C][C]0.157461[/C][C]1.2197[/C][C]0.113678[/C][/ROW]
[ROW][C]19[/C][C]0.119135[/C][C]0.9228[/C][C]0.179899[/C][/ROW]
[ROW][C]20[/C][C]0.021198[/C][C]0.1642[/C][C]0.435064[/C][/ROW]
[ROW][C]21[/C][C]-0.051111[/C][C]-0.3959[/C][C]0.34679[/C][/ROW]
[ROW][C]22[/C][C]-0.116862[/C][C]-0.9052[/C][C]0.184487[/C][/ROW]
[ROW][C]23[/C][C]-0.084661[/C][C]-0.6558[/C][C]0.257237[/C][/ROW]
[ROW][C]24[/C][C]-0.03983[/C][C]-0.3085[/C][C]0.379377[/C][/ROW]
[ROW][C]25[/C][C]-0.192448[/C][C]-1.4907[/C][C]0.07064[/C][/ROW]
[ROW][C]26[/C][C]-0.240469[/C][C]-1.8627[/C][C]0.033703[/C][/ROW]
[ROW][C]27[/C][C]-0.2667[/C][C]-2.0659[/C][C]0.021584[/C][/ROW]
[ROW][C]28[/C][C]-0.268267[/C][C]-2.078[/C][C]0.020998[/C][/ROW]
[ROW][C]29[/C][C]-0.287299[/C][C]-2.2254[/C][C]0.014912[/C][/ROW]
[ROW][C]30[/C][C]-0.290927[/C][C]-2.2535[/C][C]0.013947[/C][/ROW]
[ROW][C]31[/C][C]-0.298778[/C][C]-2.3143[/C][C]0.012045[/C][/ROW]
[ROW][C]32[/C][C]-0.326309[/C][C]-2.5276[/C][C]0.007069[/C][/ROW]
[ROW][C]33[/C][C]-0.380503[/C][C]-2.9474[/C][C]0.00228[/C][/ROW]
[ROW][C]34[/C][C]-0.369428[/C][C]-2.8616[/C][C]0.002897[/C][/ROW]
[ROW][C]35[/C][C]-0.348319[/C][C]-2.6981[/C][C]0.004522[/C][/ROW]
[ROW][C]36[/C][C]-0.274565[/C][C]-2.1268[/C][C]0.01878[/C][/ROW]
[ROW][C]37[/C][C]-0.338771[/C][C]-2.6241[/C][C]0.005501[/C][/ROW]
[ROW][C]38[/C][C]-0.319124[/C][C]-2.4719[/C][C]0.008146[/C][/ROW]
[ROW][C]39[/C][C]-0.32132[/C][C]-2.4889[/C][C]0.007802[/C][/ROW]
[ROW][C]40[/C][C]-0.301412[/C][C]-2.3347[/C][C]0.011461[/C][/ROW]
[ROW][C]41[/C][C]-0.299544[/C][C]-2.3203[/C][C]0.011873[/C][/ROW]
[ROW][C]42[/C][C]-0.279361[/C][C]-2.1639[/C][C]0.017231[/C][/ROW]
[ROW][C]43[/C][C]-0.257459[/C][C]-1.9943[/C][C]0.025336[/C][/ROW]
[ROW][C]44[/C][C]-0.260201[/C][C]-2.0155[/C][C]0.024169[/C][/ROW]
[ROW][C]45[/C][C]-0.273151[/C][C]-2.1158[/C][C]0.01926[/C][/ROW]
[ROW][C]46[/C][C]-0.26788[/C][C]-2.075[/C][C]0.021142[/C][/ROW]
[ROW][C]47[/C][C]-0.252606[/C][C]-1.9567[/C][C]0.027522[/C][/ROW]
[ROW][C]48[/C][C]-0.205945[/C][C]-1.5952[/C][C]0.057956[/C][/ROW]
[/TABLE]
Source: https://freestatistics.org/blog/index.php?pk=145440&T=1

Globally Unique Identifier (entire table): ba.freestatistics.org/blog/index.php?pk=145440&T=1

As an alternative you can also use a QR Code:  

The GUIDs for individual cells are displayed in the table below:

Autocorrelation Function
Time lag kACF(k)T-STATP-value
10.7188855.56850
20.6637365.14132e-06
30.6077584.70778e-06
40.6084334.71297e-06
50.6392024.95123e-06
60.61044.72817e-06
70.5653884.37952.4e-05
80.4592673.55750.000369
90.3787762.9340.002367
100.3238172.50830.007427
110.3658252.83370.00313
120.4933723.82160.000159
130.2820382.18470.016416
140.2291171.77470.040507
150.1777841.37710.086797
160.1831681.41880.080564
170.1775521.37530.087075
180.1574611.21970.113678
190.1191350.92280.179899
200.0211980.16420.435064
21-0.051111-0.39590.34679
22-0.116862-0.90520.184487
23-0.084661-0.65580.257237
24-0.03983-0.30850.379377
25-0.192448-1.49070.07064
26-0.240469-1.86270.033703
27-0.2667-2.06590.021584
28-0.268267-2.0780.020998
29-0.287299-2.22540.014912
30-0.290927-2.25350.013947
31-0.298778-2.31430.012045
32-0.326309-2.52760.007069
33-0.380503-2.94740.00228
34-0.369428-2.86160.002897
35-0.348319-2.69810.004522
36-0.274565-2.12680.01878
37-0.338771-2.62410.005501
38-0.319124-2.47190.008146
39-0.32132-2.48890.007802
40-0.301412-2.33470.011461
41-0.299544-2.32030.011873
42-0.279361-2.16390.017231
43-0.257459-1.99430.025336
44-0.260201-2.01550.024169
45-0.273151-2.11580.01926
46-0.26788-2.0750.021142
47-0.252606-1.95670.027522
48-0.205945-1.59520.057956


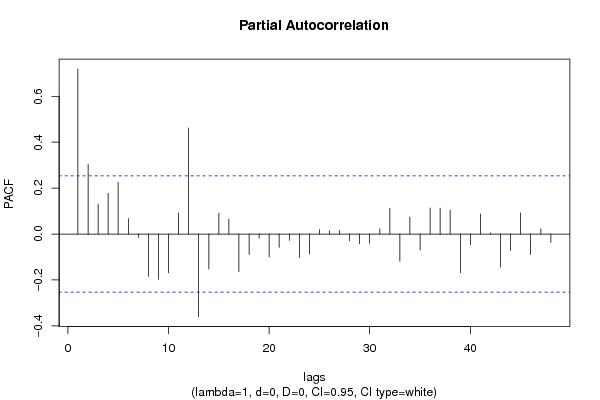
Partial Autocorrelation Function
Time lag kPACF(k)T-STATP-value
10.7188855.56850
20.3040972.35550.010891
30.1302031.00850.15862
40.1768661.370.087896
50.2248341.74160.043356
60.0671220.51990.302513
7-0.015336-0.11880.452917
8-0.184493-1.42910.079084
9-0.197656-1.5310.065509
10-0.169183-1.31050.097513
110.0918290.71130.239826
120.4617393.57660.000348
13-0.359905-2.78780.003549
14-0.152554-1.18170.120998
150.0911760.70620.241385
160.0649850.50340.308274
17-0.163316-1.2650.105374
18-0.089413-0.69260.245619
19-0.018416-0.14260.443523
20-0.099524-0.77090.221892
21-0.057912-0.44860.327674
22-0.027093-0.20990.417245
23-0.102007-0.79010.216279
24-0.086966-0.67360.251565
250.0193960.15020.440539
260.0137530.10650.457757
270.0152990.11850.453032
28-0.029742-0.23040.409289
29-0.04197-0.32510.373119
30-0.040012-0.30990.378844
310.0223060.17280.431703
320.112090.86820.194359
33-0.118259-0.9160.18166
340.0740880.57390.284097
35-0.069591-0.5390.295924
360.1136760.88050.191043
370.1126160.87230.193255
380.1039770.80540.211883
39-0.168949-1.30870.097817
40-0.046186-0.35780.360892
410.0872180.67560.25095
420.0043850.0340.486508
43-0.143467-1.11130.135438
44-0.071483-0.55370.29092
450.0917230.71050.240079
46-0.088865-0.68830.246944
470.0222680.17250.431817
48-0.036391-0.28190.389502

\begin{tabular}{lllllllll}
\hline
Partial Autocorrelation Function \tabularnewline
Time lag k & PACF(k) & T-STAT & P-value \tabularnewline
1 & 0.718885 & 5.5685 & 0 \tabularnewline
2 & 0.304097 & 2.3555 & 0.010891 \tabularnewline
3 & 0.130203 & 1.0085 & 0.15862 \tabularnewline
4 & 0.176866 & 1.37 & 0.087896 \tabularnewline
5 & 0.224834 & 1.7416 & 0.043356 \tabularnewline
6 & 0.067122 & 0.5199 & 0.302513 \tabularnewline
7 & -0.015336 & -0.1188 & 0.452917 \tabularnewline
8 & -0.184493 & -1.4291 & 0.079084 \tabularnewline
9 & -0.197656 & -1.531 & 0.065509 \tabularnewline
10 & -0.169183 & -1.3105 & 0.097513 \tabularnewline
11 & 0.091829 & 0.7113 & 0.239826 \tabularnewline
12 & 0.461739 & 3.5766 & 0.000348 \tabularnewline
13 & -0.359905 & -2.7878 & 0.003549 \tabularnewline
14 & -0.152554 & -1.1817 & 0.120998 \tabularnewline
15 & 0.091176 & 0.7062 & 0.241385 \tabularnewline
16 & 0.064985 & 0.5034 & 0.308274 \tabularnewline
17 & -0.163316 & -1.265 & 0.105374 \tabularnewline
18 & -0.089413 & -0.6926 & 0.245619 \tabularnewline
19 & -0.018416 & -0.1426 & 0.443523 \tabularnewline
20 & -0.099524 & -0.7709 & 0.221892 \tabularnewline
21 & -0.057912 & -0.4486 & 0.327674 \tabularnewline
22 & -0.027093 & -0.2099 & 0.417245 \tabularnewline
23 & -0.102007 & -0.7901 & 0.216279 \tabularnewline
24 & -0.086966 & -0.6736 & 0.251565 \tabularnewline
25 & 0.019396 & 0.1502 & 0.440539 \tabularnewline
26 & 0.013753 & 0.1065 & 0.457757 \tabularnewline
27 & 0.015299 & 0.1185 & 0.453032 \tabularnewline
28 & -0.029742 & -0.2304 & 0.409289 \tabularnewline
29 & -0.04197 & -0.3251 & 0.373119 \tabularnewline
30 & -0.040012 & -0.3099 & 0.378844 \tabularnewline
31 & 0.022306 & 0.1728 & 0.431703 \tabularnewline
32 & 0.11209 & 0.8682 & 0.194359 \tabularnewline
33 & -0.118259 & -0.916 & 0.18166 \tabularnewline
34 & 0.074088 & 0.5739 & 0.284097 \tabularnewline
35 & -0.069591 & -0.539 & 0.295924 \tabularnewline
36 & 0.113676 & 0.8805 & 0.191043 \tabularnewline
37 & 0.112616 & 0.8723 & 0.193255 \tabularnewline
38 & 0.103977 & 0.8054 & 0.211883 \tabularnewline
39 & -0.168949 & -1.3087 & 0.097817 \tabularnewline
40 & -0.046186 & -0.3578 & 0.360892 \tabularnewline
41 & 0.087218 & 0.6756 & 0.25095 \tabularnewline
42 & 0.004385 & 0.034 & 0.486508 \tabularnewline
43 & -0.143467 & -1.1113 & 0.135438 \tabularnewline
44 & -0.071483 & -0.5537 & 0.29092 \tabularnewline
45 & 0.091723 & 0.7105 & 0.240079 \tabularnewline
46 & -0.088865 & -0.6883 & 0.246944 \tabularnewline
47 & 0.022268 & 0.1725 & 0.431817 \tabularnewline
48 & -0.036391 & -0.2819 & 0.389502 \tabularnewline
\hline
\end{tabular}
%Source: https://freestatistics.org/blog/index.php?pk=145440&T=2

[TABLE]
[ROW][C]Partial Autocorrelation Function[/C][/ROW]
[ROW][C]Time lag k[/C][C]PACF(k)[/C][C]T-STAT[/C][C]P-value[/C][/ROW]
[ROW][C]1[/C][C]0.718885[/C][C]5.5685[/C][C]0[/C][/ROW]
[ROW][C]2[/C][C]0.304097[/C][C]2.3555[/C][C]0.010891[/C][/ROW]
[ROW][C]3[/C][C]0.130203[/C][C]1.0085[/C][C]0.15862[/C][/ROW]
[ROW][C]4[/C][C]0.176866[/C][C]1.37[/C][C]0.087896[/C][/ROW]
[ROW][C]5[/C][C]0.224834[/C][C]1.7416[/C][C]0.043356[/C][/ROW]
[ROW][C]6[/C][C]0.067122[/C][C]0.5199[/C][C]0.302513[/C][/ROW]
[ROW][C]7[/C][C]-0.015336[/C][C]-0.1188[/C][C]0.452917[/C][/ROW]
[ROW][C]8[/C][C]-0.184493[/C][C]-1.4291[/C][C]0.079084[/C][/ROW]
[ROW][C]9[/C][C]-0.197656[/C][C]-1.531[/C][C]0.065509[/C][/ROW]
[ROW][C]10[/C][C]-0.169183[/C][C]-1.3105[/C][C]0.097513[/C][/ROW]
[ROW][C]11[/C][C]0.091829[/C][C]0.7113[/C][C]0.239826[/C][/ROW]
[ROW][C]12[/C][C]0.461739[/C][C]3.5766[/C][C]0.000348[/C][/ROW]
[ROW][C]13[/C][C]-0.359905[/C][C]-2.7878[/C][C]0.003549[/C][/ROW]
[ROW][C]14[/C][C]-0.152554[/C][C]-1.1817[/C][C]0.120998[/C][/ROW]
[ROW][C]15[/C][C]0.091176[/C][C]0.7062[/C][C]0.241385[/C][/ROW]
[ROW][C]16[/C][C]0.064985[/C][C]0.5034[/C][C]0.308274[/C][/ROW]
[ROW][C]17[/C][C]-0.163316[/C][C]-1.265[/C][C]0.105374[/C][/ROW]
[ROW][C]18[/C][C]-0.089413[/C][C]-0.6926[/C][C]0.245619[/C][/ROW]
[ROW][C]19[/C][C]-0.018416[/C][C]-0.1426[/C][C]0.443523[/C][/ROW]
[ROW][C]20[/C][C]-0.099524[/C][C]-0.7709[/C][C]0.221892[/C][/ROW]
[ROW][C]21[/C][C]-0.057912[/C][C]-0.4486[/C][C]0.327674[/C][/ROW]
[ROW][C]22[/C][C]-0.027093[/C][C]-0.2099[/C][C]0.417245[/C][/ROW]
[ROW][C]23[/C][C]-0.102007[/C][C]-0.7901[/C][C]0.216279[/C][/ROW]
[ROW][C]24[/C][C]-0.086966[/C][C]-0.6736[/C][C]0.251565[/C][/ROW]
[ROW][C]25[/C][C]0.019396[/C][C]0.1502[/C][C]0.440539[/C][/ROW]
[ROW][C]26[/C][C]0.013753[/C][C]0.1065[/C][C]0.457757[/C][/ROW]
[ROW][C]27[/C][C]0.015299[/C][C]0.1185[/C][C]0.453032[/C][/ROW]
[ROW][C]28[/C][C]-0.029742[/C][C]-0.2304[/C][C]0.409289[/C][/ROW]
[ROW][C]29[/C][C]-0.04197[/C][C]-0.3251[/C][C]0.373119[/C][/ROW]
[ROW][C]30[/C][C]-0.040012[/C][C]-0.3099[/C][C]0.378844[/C][/ROW]
[ROW][C]31[/C][C]0.022306[/C][C]0.1728[/C][C]0.431703[/C][/ROW]
[ROW][C]32[/C][C]0.11209[/C][C]0.8682[/C][C]0.194359[/C][/ROW]
[ROW][C]33[/C][C]-0.118259[/C][C]-0.916[/C][C]0.18166[/C][/ROW]
[ROW][C]34[/C][C]0.074088[/C][C]0.5739[/C][C]0.284097[/C][/ROW]
[ROW][C]35[/C][C]-0.069591[/C][C]-0.539[/C][C]0.295924[/C][/ROW]
[ROW][C]36[/C][C]0.113676[/C][C]0.8805[/C][C]0.191043[/C][/ROW]
[ROW][C]37[/C][C]0.112616[/C][C]0.8723[/C][C]0.193255[/C][/ROW]
[ROW][C]38[/C][C]0.103977[/C][C]0.8054[/C][C]0.211883[/C][/ROW]
[ROW][C]39[/C][C]-0.168949[/C][C]-1.3087[/C][C]0.097817[/C][/ROW]
[ROW][C]40[/C][C]-0.046186[/C][C]-0.3578[/C][C]0.360892[/C][/ROW]
[ROW][C]41[/C][C]0.087218[/C][C]0.6756[/C][C]0.25095[/C][/ROW]
[ROW][C]42[/C][C]0.004385[/C][C]0.034[/C][C]0.486508[/C][/ROW]
[ROW][C]43[/C][C]-0.143467[/C][C]-1.1113[/C][C]0.135438[/C][/ROW]
[ROW][C]44[/C][C]-0.071483[/C][C]-0.5537[/C][C]0.29092[/C][/ROW]
[ROW][C]45[/C][C]0.091723[/C][C]0.7105[/C][C]0.240079[/C][/ROW]
[ROW][C]46[/C][C]-0.088865[/C][C]-0.6883[/C][C]0.246944[/C][/ROW]
[ROW][C]47[/C][C]0.022268[/C][C]0.1725[/C][C]0.431817[/C][/ROW]
[ROW][C]48[/C][C]-0.036391[/C][C]-0.2819[/C][C]0.389502[/C][/ROW]
[/TABLE]
Source: https://freestatistics.org/blog/index.php?pk=145440&T=2

Globally Unique Identifier (entire table): ba.freestatistics.org/blog/index.php?pk=145440&T=2

As an alternative you can also use a QR Code:  

The GUIDs for individual cells are displayed in the table below:

Partial Autocorrelation Function
Time lag kPACF(k)T-STATP-value
10.7188855.56850
20.3040972.35550.010891
30.1302031.00850.15862
40.1768661.370.087896
50.2248341.74160.043356
60.0671220.51990.302513
7-0.015336-0.11880.452917
8-0.184493-1.42910.079084
9-0.197656-1.5310.065509
10-0.169183-1.31050.097513
110.0918290.71130.239826
120.4617393.57660.000348
13-0.359905-2.78780.003549
14-0.152554-1.18170.120998
150.0911760.70620.241385
160.0649850.50340.308274
17-0.163316-1.2650.105374
18-0.089413-0.69260.245619
19-0.018416-0.14260.443523
20-0.099524-0.77090.221892
21-0.057912-0.44860.327674
22-0.027093-0.20990.417245
23-0.102007-0.79010.216279
24-0.086966-0.67360.251565
250.0193960.15020.440539
260.0137530.10650.457757
270.0152990.11850.453032
28-0.029742-0.23040.409289
29-0.04197-0.32510.373119
30-0.040012-0.30990.378844
310.0223060.17280.431703
320.112090.86820.194359
33-0.118259-0.9160.18166
340.0740880.57390.284097
35-0.069591-0.5390.295924
360.1136760.88050.191043
370.1126160.87230.193255
380.1039770.80540.211883
39-0.168949-1.30870.097817
40-0.046186-0.35780.360892
410.0872180.67560.25095
420.0043850.0340.486508
43-0.143467-1.11130.135438
44-0.071483-0.55370.29092
450.0917230.71050.240079
46-0.088865-0.68830.246944
470.0222680.17250.431817
48-0.036391-0.28190.389502


Parameters (Session):
par1 = 48 ; par2 = 1 ; par3 = 0 ; par4 = 0 ; par5 = 12 ; par6 = White Noise ; par7 = 0.95 ;
Parameters (R input):
par1 = 48 ; par2 = 1 ; par3 = 0 ; par4 = 0 ; par5 = 12 ; par6 = White Noise ; par7 = 0.95 ; par8 = ;
R code (references can be found in the software module):
if (par1 == 'Default') {
par1 = 10*log10(length(x))
} else {
par1 <- as.numeric(par1)
}
par2 <- as.numeric(par2)
par3 <- as.numeric(par3)
par4 <- as.numeric(par4)
par5 <- as.numeric(par5)
if (par6 == 'White Noise') par6 <- 'white' else par6 <- 'ma'
par7 <- as.numeric(par7)
if (par8 != '') par8 <- as.numeric(par8)
ox <- x
if (par8 == '') {
if (par2 == 0) {
x <- log(x)
} else {
x <- (x ^ par2 - 1) / par2
}
} else {
x <- log(x,base=par8)
}
if (par3 > 0) x <- diff(x,lag=1,difference=par3)
if (par4 > 0) x <- diff(x,lag=par5,difference=par4)
bitmap(file='picts.png')
op <- par(mfrow=c(2,1))
plot(ox,type='l',main='Original Time Series',xlab='time',ylab='value')
if (par8=='') {
mytitle <- paste('Working Time Series (lambda=',par2,', d=',par3,', D=',par4,')',sep='')
mysub <- paste('(lambda=',par2,', d=',par3,', D=',par4,', CI=', par7, ', CI type=',par6,')',sep='')
} else {
mytitle <- paste('Working Time Series (base=',par8,', d=',par3,', D=',par4,')',sep='')
mysub <- paste('(base=',par8,', d=',par3,', D=',par4,', CI=', par7, ', CI type=',par6,')',sep='')
}
plot(x,type='l', main=mytitle,xlab='time',ylab='value')
par(op)
dev.off()
bitmap(file='pic1.png')
racf <- acf(x, par1, main='Autocorrelation', xlab='time lag', ylab='ACF', ci.type=par6, ci=par7, sub=mysub)
dev.off()
bitmap(file='pic2.png')
rpacf <- pacf(x,par1,main='Partial Autocorrelation',xlab='lags',ylab='PACF',sub=mysub)
dev.off()
(myacf <- c(racf$acf))
(mypacf <- c(rpacf$acf))
lengthx <- length(x)
sqrtn <- sqrt(lengthx)
load(file='createtable')
a<-table.start()
a<-table.row.start(a)
a<-table.element(a,'Autocorrelation Function',4,TRUE)
a<-table.row.end(a)
a<-table.row.start(a)
a<-table.element(a,'Time lag k',header=TRUE)
a<-table.element(a,hyperlink('basics.htm','ACF(k)','click here for more information about the Autocorrelation Function'),header=TRUE)
a<-table.element(a,'T-STAT',header=TRUE)
a<-table.element(a,'P-value',header=TRUE)
a<-table.row.end(a)
for (i in 2:(par1+1)) {
a<-table.row.start(a)
a<-table.element(a,i-1,header=TRUE)
a<-table.element(a,round(myacf[i],6))
mytstat <- myacf[i]*sqrtn
a<-table.element(a,round(mytstat,4))
a<-table.element(a,round(1-pt(abs(mytstat),lengthx),6))
a<-table.row.end(a)
}
a<-table.end(a)
table.save(a,file='mytable.tab')
a<-table.start()
a<-table.row.start(a)
a<-table.element(a,'Partial Autocorrelation Function',4,TRUE)
a<-table.row.end(a)
a<-table.row.start(a)
a<-table.element(a,'Time lag k',header=TRUE)
a<-table.element(a,hyperlink('basics.htm','PACF(k)','click here for more information about the Partial Autocorrelation Function'),header=TRUE)
a<-table.element(a,'T-STAT',header=TRUE)
a<-table.element(a,'P-value',header=TRUE)
a<-table.row.end(a)
for (i in 1:par1) {
a<-table.row.start(a)
a<-table.element(a,i,header=TRUE)
a<-table.element(a,round(mypacf[i],6))
mytstat <- mypacf[i]*sqrtn
a<-table.element(a,round(mytstat,4))
a<-table.element(a,round(1-pt(abs(mytstat),lengthx),6))
a<-table.row.end(a)
}
a<-table.end(a)
table.save(a,file='mytable1.tab')