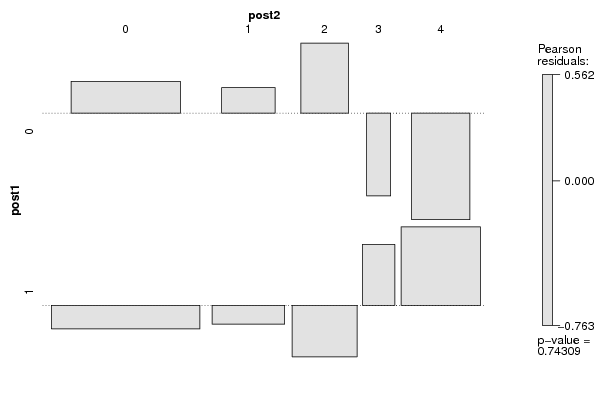
| Tabulation of Results | |||||
| post1 x post2 | |||||
| 0 | 1 | 2 | 3 | 4 | 0 | 8 | 2 | 2 | 0 | 1 | 1 | 13 | 3 | 2 | 1 | 5 |
| Tabulation of Expected Results | |||||
| post1 x post2 | |||||
| 0 | 1 | 2 | 3 | 4 | 0 | 7.38 | 1.76 | 1.41 | 0.35 | 2.11 | 1 | 13.62 | 3.24 | 2.59 | 0.65 | 3.89 |
| Statistical Results | |
| Pearson's Chi-squared test | |
| Chi Square Statistic | 1.96 |
| Degrees of Freedom | 4 |
| P value | 0.74 |