| Tabulation of Results | ||||
| Software x Depression | ||||
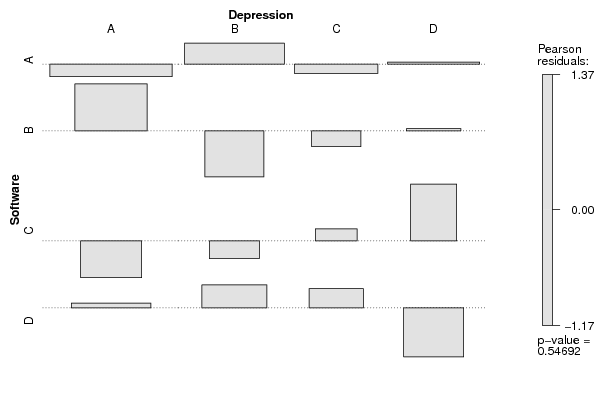
| A | B | C | D | A | 28 | 22 | 13 | 17 | B | 14 | 4 | 4 | 6 | C | 5 | 4 | 4 | 7 | D | 13 | 10 | 7 | 4 |
| Tabulation of Expected Results | ||||
| Software x Depression | ||||
| A | B | C | D | A | 29.63 | 19.75 | 13.83 | 16.79 | B | 10.37 | 6.91 | 4.84 | 5.88 | C | 7.41 | 4.94 | 3.46 | 4.2 | D | 12.59 | 8.4 | 5.88 | 7.14 |
| Statistical Results | |
| Pearson's Chi-squared test | |
| Pearson Chi Square Statistic | 7.87 |
| Degrees of Freedom | 9 |
| P value | 0.55 |