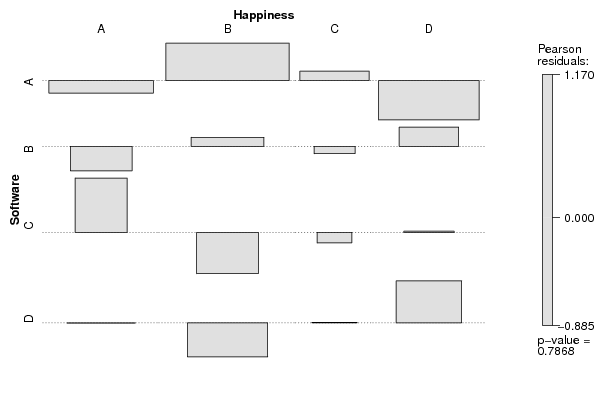
| Tabulation of Results | ||||
| Software x Happiness | ||||
| A | B | C | D | A | 20 | 34 | 10 | 16 | B | 6 | 11 | 3 | 8 | C | 8 | 5 | 2 | 5 | D | 9 | 10 | 4 | 11 |
| Tabulation of Expected Results | ||||
| Software x Happiness | ||||
| A | B | C | D | A | 21.23 | 29.63 | 9.38 | 19.75 | B | 7.43 | 10.37 | 3.28 | 6.91 | C | 5.31 | 7.41 | 2.35 | 4.94 | D | 9.02 | 12.59 | 3.99 | 8.4 |
| Statistical Results | |
| Pearson's Chi-squared test | |
| Pearson Chi Square Statistic | 5.52 |
| Degrees of Freedom | 9 |
| P value | 0.79 |