| Tabulation of Results | ||||
| Separate x Software | ||||
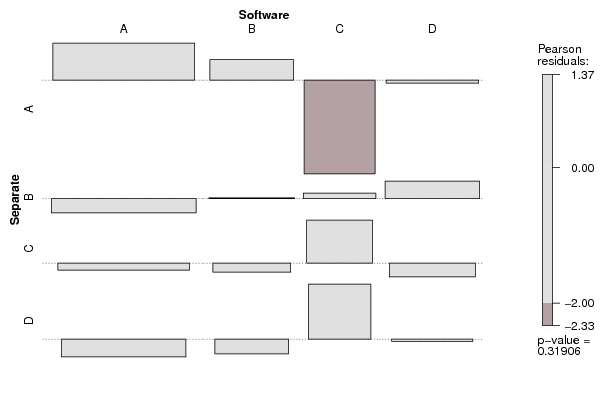
| A | B | C | D | A | 26 | 9 | 0 | 9 | B | 21 | 8 | 6 | 11 | C | 18 | 6 | 7 | 7 | D | 15 | 5 | 7 | 7 |
| Tabulation of Expected Results | ||||
| Separate x Software | ||||
| A | B | C | D | A | 21.73 | 7.6 | 5.43 | 9.23 | B | 22.72 | 7.95 | 5.68 | 9.65 | C | 18.77 | 6.57 | 4.69 | 7.98 | D | 16.79 | 5.88 | 4.2 | 7.14 |
| Statistical Results | |
| Pearson's Chi-squared test | |
| Pearson Chi Square Statistic | 10.4 |
| Degrees of Freedom | 9 |
| P value | 0.32 |