| Tabulation of Results | ||||
| Connected x Software | ||||
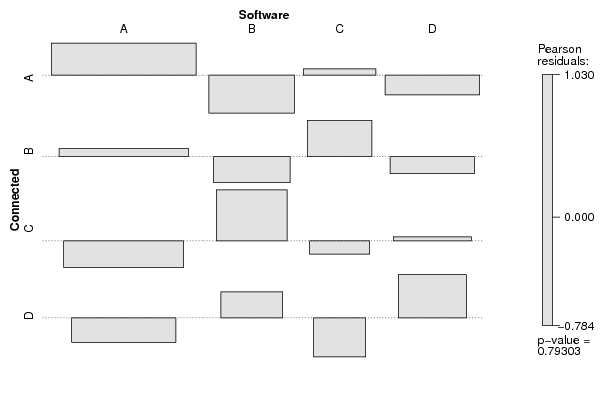
| A | B | C | D | A | 30 | 7 | 7 | 10 | B | 22 | 6 | 7 | 8 | C | 16 | 9 | 4 | 8 | D | 12 | 6 | 2 | 8 |
| Tabulation of Expected Results | ||||
| Connected x Software | ||||
| A | B | C | D | A | 26.67 | 9.33 | 6.67 | 11.33 | B | 21.23 | 7.43 | 5.31 | 9.02 | C | 18.27 | 6.4 | 4.57 | 7.77 | D | 13.83 | 4.84 | 3.46 | 5.88 |
| Statistical Results | |
| Pearson's Chi-squared test | |
| Pearson Chi Square Statistic | 5.45 |
| Degrees of Freedom | 9 |
| P value | 0.79 |