Free Statistics

of Irreproducible Research!

Author's title

Author*The author of this computation has been verified*
R Software Modulerwasp_cross.wasp
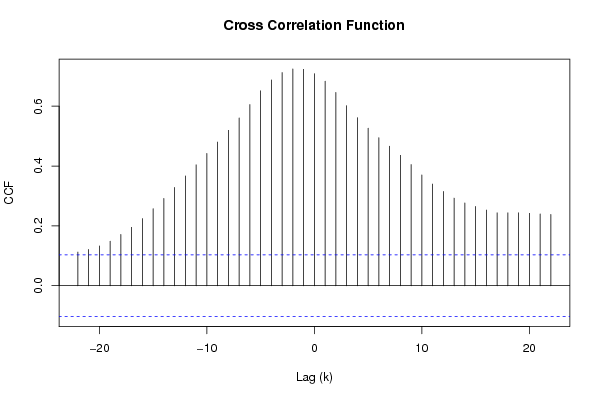
Title produced by softwareCross Correlation Function
Date of computationThu, 17 Nov 2011 10:40:25 -0500
Cite this page as followsStatistical Computations at FreeStatistics.org, Office for Research Development and Education, URL https://freestatistics.org/blog/index.php?v=date/2011/Nov/17/t13215444734n7uesxulet50f5.htm/, Retrieved Wed, 24 Apr 2024 22:38:49 +0000
Statistical Computations at FreeStatistics.org, Office for Research Development and Education, URL https://freestatistics.org/blog/index.php?pk=144951, Retrieved Wed, 24 Apr 2024 22:38:49 +0000
QR Codes:

Original text written by user:
IsPrivate?No (this computation is public)
User-defined keywords
Estimated Impact62
Family? (F = Feedback message, R = changed R code, M = changed R Module, P = changed Parameters, D = changed Data)
-       [Cross Correlation Function] [cross correlation] [2011-11-17 15:40:25] [98013ab554c8e0dbe4733b402984d95f] [Current]
Feedback Forum

Post a new message
Dataseries X:
87.28
87.28
87.09
86.92
87.59
90.72
90.69
90.3
89.55
88.94
88.41
87.82
87.07
86.82
86.4
86.02
85.66
85.32
85
84.67
83.94
82.83
81.95
81.19
80.48
78.86
69.47
68.77
70.06
73.95
75.8
77.79
81.57
83.07
84.34
85.1
85.25
84.26
83.63
86.44
85.3
84.1
83.36
82.48
81.58
80.47
79.34
82.13
81.69
80.7
79.88
79.16
78.38
77.42
76.47
75.46
74.48
78.27
80.7
79.91
78.75
77.78
81.14
81.08
80.03
78.91
78.01
76.9
75.97
81.93
80.27
78.67
77.42
76.16
74.7
76.39
76.04
74.65
73.29
71.79
74.39
74.91
74.54
73.08
72.75
71.32
70.38
70.35
70.01
69.36
67.77
69.26
69.8
68.38
67.62
68.39
66.95
65.21
66.64
63.45
60.66
62.34
60.32
58.64
60.46
58.59
61.87
61.85
67.44
77.06
91.74
93.15
94.15
93.11
91.51
89.96
88.16
86.98
88.03
86.24
84.65
83.23
81.7
80.25
78.8
77.51
76.2
75.04
74
75.49
77.14
76.15
76.27
78.19
76.49
77.31
76.65
74.99
73.51
72.07
70.59
71.96
76.29
74.86
74.93
71.9
71.01
77.47
75.78
76.6
76.07
74.57
73.02
72.65
73.16
71.53
69.78
67.98
69.96
72.16
70.47
68.86
67.37
65.87
72.16
71.34
69.93
68.44
67.16
66.01
67.25
70.91
69.75
68.59
67.48
66.31
64.81
66.58
65.97
64.7
64.7
60.94
59.08
58.42
57.77
57.11
53.31
49.96
49.4
48.84
48.3
47.74
47.24
46.76
46.29
48.9
49.23
48.53
48.03
54.34
53.79
53.24
52.96
52.17
51.7
58.55
78.2
77.03
76.19
77.15
75.87
95.47
109.67
112.28
112.01
107.93
105.96
105.06
102.98
102.2
105.23
101.85
99.89
96.23
94.76
91.51
91.63
91.54
85.23
87.83
87.38
84.44
85.19
84.03
86.73
102.52
104.45
106.98
107.02
99.26
94.45
113.44
157.33
147.38
171.89
171.95
132.71
126.02
121.18
115.45
110.48
117.85
117.63
124.65
109.59
111.27
99.78
98.21
99.2
97.97
89.55
87.91
93.34
94.42
93.2
90.29
91.46
89.98
88.35
88.41
82.44
79.89
75.69
75.66
84.5
96.73
87.48
82.39
83.48
79.31
78.16
72.77
72.45
68.46
67.62
68.76
70.07
68.55
65.3
58.96
59.17
62.37
66.28
55.62
55.23
55.85
56.75
50.89
53.88
52.95
55.08
53.61
58.78
61.85
55.91
53.32
46.41
44.57
50
50
53.36
46.23
50.45
49.07
45.85
48.45
49.96
46.53
50.51
47.58
48.05
46.84
47.67
49.16
55.54
55.82
58.22
56.19
57.77
63.19
54.76
55.74
62.54
61.39
69.6
79.23
80
93.68
107.63
100.18
97.3
90.45
80.64
80.58
75.82
85.59
89.35
89.42
104.73
95.32
89.27
90.44
86.97
79.98
81.22
87.35
83.64
82.22
94.4
102.18
Dataseries Y:
255
280.2
299.9
339.2
374.2
393.5
389.2
381.7
375.2
369
357.4
352.1
346.5
342.9
340.3
328.3
322.9
314.3
308.9
294
285.6
281.2
280.3
278.8
274.5
270.4
263.4
259.9
258
262.7
284.7
311.3
322.1
327
331.3
333.3
321.4
327
320
314.7
316.7
314.4
321.3
318.2
307.2
301.3
287.5
277.7
274.4
258.8
253.3
251
248.4
249.5
246.1
244.5
243.6
244
240.8
249.8
248
259.4
260.5
260.8
261.3
259.5
256.6
257.9
256.5
254.2
253.3
253.8
255.5
257.1
257.3
253.2
252.8
252
250.7
252.2
250
251
253.4
251.2
255.6
261.1
258.9
259.9
261.2
264.7
267.1
266.4
267.7
268.6
267.5
268.5
268.5
270.5
270.9
270.1
269.3
269.8
270.1
264.9
263.7
264.8
263.7
255.9
276.2
360.1
380.5
373.7
369.8
366.6
359.3
345.8
326.2
324.5
328.1
327.5
324.4
316.5
310.9
301.5
291.7
290.4
287.4
277.7
281.6
288
276
272.9
283
283.3
276.8
284.5
282.7
281.2
287.4
283.1
284
285.5
289.2
292.5
296.4
305.2
303.9
311.5
316.3
316.7
322.5
317.1
309.8
303.8
290.3
293.7
291.7
296.5
289.1
288.5
293.8
297.7
305.4
302.7
302.5
303
294.5
294.1
294.5
297.1
289.4
292.4
287.9
286.6
280.5
272.4
269.2
270.6
267.3
262.5
266.8
268.8
263.1
261.2
266
262.5
265.2
261.3
253.7
249.2
239.1
236.4
235.2
245.2
246.2
247.7
251.4
253.3
254.8
250
249.3
241.5
243.3
248
253
252.9
251.5
251.6
253.5
259.8
334.1
448
445.8
445
448.2
438.2
439.8
423.4
410.8
408.4
406.7
405.9
402.7
405.1
399.6
386.5
381.4
375.2
357.7
359
355
352.7
344.4
343.8
338
339
333.3
334.4
328.3
330.7
330
331.6
351.2
389.4
410.9
442.8
462.8
466.9
461.7
439.2
430.3
416.1
402.5
397.3
403.3
395.9
387.8
378.6
377.1
370.4
362
350.3
348.2
344.6
343.5
342.8
347.6
346.6
349.5
342.1
342
342.8
339.3
348.2
333.7
334.7
354
367.7
363.3
358.4
353.1
343.1
344.6
344.4
333.9
331.7
324.3
321.2
322.4
321.7
320.5
312.8
309.7
315.6
309.7
304.6
302.5
301.5
298.8
291.3
293.6
294.6
285.9
297.6
301.1
293.8
297.7
292.9
292.1
287.2
288.2
283.8
299.9
292.4
293.3
300.8
293.7
293.1
294.4
292.1
291.9
282.5
277.9
287.5
289.2
285.6
293.2
290.8
283.1
275
287.8
287.8
287.4
284
277.8
277.6
304.9
294
300.9
324
332.9
341.6
333.4
348.2
344.7
344.7
329.3
323.5
323.2
317.4
330.1
329.2
334.9
315.8
315.4
319.6
317.3
313.8
315.8
311.3


Summary of computational transaction
Raw Inputview raw input (R code)
Raw Outputview raw output of R engine
Computing time1 seconds
R Server'George Udny Yule' @ yule.wessa.net

\begin{tabular}{lllllllll}
\hline
Summary of computational transaction \tabularnewline
Raw Input & view raw input (R code)  \tabularnewline
Raw Output & view raw output of R engine  \tabularnewline
Computing time & 1 seconds \tabularnewline
R Server & 'George Udny Yule' @ yule.wessa.net \tabularnewline
\hline
\end{tabular}
%Source: https://freestatistics.org/blog/index.php?pk=144951&T=0

[TABLE]
[ROW][C]Summary of computational transaction[/C][/ROW]
[ROW][C]Raw Input[/C][C]view raw input (R code) [/C][/ROW]
[ROW][C]Raw Output[/C][C]view raw output of R engine [/C][/ROW]
[ROW][C]Computing time[/C][C]1 seconds[/C][/ROW]
[ROW][C]R Server[/C][C]'George Udny Yule' @ yule.wessa.net[/C][/ROW]
[/TABLE]
Source: https://freestatistics.org/blog/index.php?pk=144951&T=0

Globally Unique Identifier (entire table): ba.freestatistics.org/blog/index.php?pk=144951&T=0

As an alternative you can also use a QR Code:  

The GUIDs for individual cells are displayed in the table below:

Summary of computational transaction
Raw Inputview raw input (R code)
Raw Outputview raw output of R engine
Computing time1 seconds
R Server'George Udny Yule' @ yule.wessa.net


Cross Correlation Function
ParameterValue
Box-Cox transformation parameter (lambda) of X series1
Degree of non-seasonal differencing (d) of X series0
Degree of seasonal differencing (D) of X series0
Seasonal Period (s)1
Box-Cox transformation parameter (lambda) of Y series1
Degree of non-seasonal differencing (d) of Y series0
Degree of seasonal differencing (D) of Y series0
krho(Y[t],X[t+k])
-220.112307310768481
-210.120926747640992
-200.132954901789523
-190.148422421356172
-180.171056001303519
-170.195101263022441
-160.224169234992396
-150.257169745101771
-140.291826120061068
-130.328184165496555
-120.366561375147541
-110.403891471180892
-100.442125650692474
-90.479873982256154
-80.519110021355975
-70.560732381296181
-60.605286896599146
-50.651173518652785
-40.687261109444114
-30.712119617026077
-20.724418298869304
-10.723095154696557
00.708290117736514
10.6832799529677
20.645603399963093
30.601416820197678
40.561170257685698
50.526211750776637
60.494496789657503
70.466053640766634
80.4357554055989
90.404759633228641
100.369975453967108
110.339663310082494
120.315017484518996
130.292681114000377
140.276596315028451
150.264841600497668
160.252789354291837
170.243425098432089
180.243626930616505
190.243576939510522
200.241900629934842
210.239723259611653
220.238279031091977

\begin{tabular}{lllllllll}
\hline
Cross Correlation Function \tabularnewline
Parameter & Value \tabularnewline
Box-Cox transformation parameter (lambda) of X series & 1 \tabularnewline
Degree of non-seasonal differencing (d) of X series & 0 \tabularnewline
Degree of seasonal differencing (D) of X series & 0 \tabularnewline
Seasonal Period (s) & 1 \tabularnewline
Box-Cox transformation parameter (lambda) of Y series & 1 \tabularnewline
Degree of non-seasonal differencing (d) of Y series & 0 \tabularnewline
Degree of seasonal differencing (D) of Y series & 0 \tabularnewline
k & rho(Y[t],X[t+k]) \tabularnewline
-22 & 0.112307310768481 \tabularnewline
-21 & 0.120926747640992 \tabularnewline
-20 & 0.132954901789523 \tabularnewline
-19 & 0.148422421356172 \tabularnewline
-18 & 0.171056001303519 \tabularnewline
-17 & 0.195101263022441 \tabularnewline
-16 & 0.224169234992396 \tabularnewline
-15 & 0.257169745101771 \tabularnewline
-14 & 0.291826120061068 \tabularnewline
-13 & 0.328184165496555 \tabularnewline
-12 & 0.366561375147541 \tabularnewline
-11 & 0.403891471180892 \tabularnewline
-10 & 0.442125650692474 \tabularnewline
-9 & 0.479873982256154 \tabularnewline
-8 & 0.519110021355975 \tabularnewline
-7 & 0.560732381296181 \tabularnewline
-6 & 0.605286896599146 \tabularnewline
-5 & 0.651173518652785 \tabularnewline
-4 & 0.687261109444114 \tabularnewline
-3 & 0.712119617026077 \tabularnewline
-2 & 0.724418298869304 \tabularnewline
-1 & 0.723095154696557 \tabularnewline
0 & 0.708290117736514 \tabularnewline
1 & 0.6832799529677 \tabularnewline
2 & 0.645603399963093 \tabularnewline
3 & 0.601416820197678 \tabularnewline
4 & 0.561170257685698 \tabularnewline
5 & 0.526211750776637 \tabularnewline
6 & 0.494496789657503 \tabularnewline
7 & 0.466053640766634 \tabularnewline
8 & 0.4357554055989 \tabularnewline
9 & 0.404759633228641 \tabularnewline
10 & 0.369975453967108 \tabularnewline
11 & 0.339663310082494 \tabularnewline
12 & 0.315017484518996 \tabularnewline
13 & 0.292681114000377 \tabularnewline
14 & 0.276596315028451 \tabularnewline
15 & 0.264841600497668 \tabularnewline
16 & 0.252789354291837 \tabularnewline
17 & 0.243425098432089 \tabularnewline
18 & 0.243626930616505 \tabularnewline
19 & 0.243576939510522 \tabularnewline
20 & 0.241900629934842 \tabularnewline
21 & 0.239723259611653 \tabularnewline
22 & 0.238279031091977 \tabularnewline
\hline
\end{tabular}
%Source: https://freestatistics.org/blog/index.php?pk=144951&T=1

[TABLE]
[ROW][C]Cross Correlation Function[/C][/ROW]
[ROW][C]Parameter[/C][C]Value[/C][/ROW]
[ROW][C]Box-Cox transformation parameter (lambda) of X series[/C][C]1[/C][/ROW]
[ROW][C]Degree of non-seasonal differencing (d) of X series[/C][C]0[/C][/ROW]
[ROW][C]Degree of seasonal differencing (D) of X series[/C][C]0[/C][/ROW]
[ROW][C]Seasonal Period (s)[/C][C]1[/C][/ROW]
[ROW][C]Box-Cox transformation parameter (lambda) of Y series[/C][C]1[/C][/ROW]
[ROW][C]Degree of non-seasonal differencing (d) of Y series[/C][C]0[/C][/ROW]
[ROW][C]Degree of seasonal differencing (D) of Y series[/C][C]0[/C][/ROW]
[ROW][C]k[/C][C]rho(Y[t],X[t+k])[/C][/ROW]
[ROW][C]-22[/C][C]0.112307310768481[/C][/ROW]
[ROW][C]-21[/C][C]0.120926747640992[/C][/ROW]
[ROW][C]-20[/C][C]0.132954901789523[/C][/ROW]
[ROW][C]-19[/C][C]0.148422421356172[/C][/ROW]
[ROW][C]-18[/C][C]0.171056001303519[/C][/ROW]
[ROW][C]-17[/C][C]0.195101263022441[/C][/ROW]
[ROW][C]-16[/C][C]0.224169234992396[/C][/ROW]
[ROW][C]-15[/C][C]0.257169745101771[/C][/ROW]
[ROW][C]-14[/C][C]0.291826120061068[/C][/ROW]
[ROW][C]-13[/C][C]0.328184165496555[/C][/ROW]
[ROW][C]-12[/C][C]0.366561375147541[/C][/ROW]
[ROW][C]-11[/C][C]0.403891471180892[/C][/ROW]
[ROW][C]-10[/C][C]0.442125650692474[/C][/ROW]
[ROW][C]-9[/C][C]0.479873982256154[/C][/ROW]
[ROW][C]-8[/C][C]0.519110021355975[/C][/ROW]
[ROW][C]-7[/C][C]0.560732381296181[/C][/ROW]
[ROW][C]-6[/C][C]0.605286896599146[/C][/ROW]
[ROW][C]-5[/C][C]0.651173518652785[/C][/ROW]
[ROW][C]-4[/C][C]0.687261109444114[/C][/ROW]
[ROW][C]-3[/C][C]0.712119617026077[/C][/ROW]
[ROW][C]-2[/C][C]0.724418298869304[/C][/ROW]
[ROW][C]-1[/C][C]0.723095154696557[/C][/ROW]
[ROW][C]0[/C][C]0.708290117736514[/C][/ROW]
[ROW][C]1[/C][C]0.6832799529677[/C][/ROW]
[ROW][C]2[/C][C]0.645603399963093[/C][/ROW]
[ROW][C]3[/C][C]0.601416820197678[/C][/ROW]
[ROW][C]4[/C][C]0.561170257685698[/C][/ROW]
[ROW][C]5[/C][C]0.526211750776637[/C][/ROW]
[ROW][C]6[/C][C]0.494496789657503[/C][/ROW]
[ROW][C]7[/C][C]0.466053640766634[/C][/ROW]
[ROW][C]8[/C][C]0.4357554055989[/C][/ROW]
[ROW][C]9[/C][C]0.404759633228641[/C][/ROW]
[ROW][C]10[/C][C]0.369975453967108[/C][/ROW]
[ROW][C]11[/C][C]0.339663310082494[/C][/ROW]
[ROW][C]12[/C][C]0.315017484518996[/C][/ROW]
[ROW][C]13[/C][C]0.292681114000377[/C][/ROW]
[ROW][C]14[/C][C]0.276596315028451[/C][/ROW]
[ROW][C]15[/C][C]0.264841600497668[/C][/ROW]
[ROW][C]16[/C][C]0.252789354291837[/C][/ROW]
[ROW][C]17[/C][C]0.243425098432089[/C][/ROW]
[ROW][C]18[/C][C]0.243626930616505[/C][/ROW]
[ROW][C]19[/C][C]0.243576939510522[/C][/ROW]
[ROW][C]20[/C][C]0.241900629934842[/C][/ROW]
[ROW][C]21[/C][C]0.239723259611653[/C][/ROW]
[ROW][C]22[/C][C]0.238279031091977[/C][/ROW]
[/TABLE]
Source: https://freestatistics.org/blog/index.php?pk=144951&T=1

Globally Unique Identifier (entire table): ba.freestatistics.org/blog/index.php?pk=144951&T=1

As an alternative you can also use a QR Code:  

The GUIDs for individual cells are displayed in the table below:

Cross Correlation Function
ParameterValue
Box-Cox transformation parameter (lambda) of X series1
Degree of non-seasonal differencing (d) of X series0
Degree of seasonal differencing (D) of X series0
Seasonal Period (s)1
Box-Cox transformation parameter (lambda) of Y series1
Degree of non-seasonal differencing (d) of Y series0
Degree of seasonal differencing (D) of Y series0
krho(Y[t],X[t+k])
-220.112307310768481
-210.120926747640992
-200.132954901789523
-190.148422421356172
-180.171056001303519
-170.195101263022441
-160.224169234992396
-150.257169745101771
-140.291826120061068
-130.328184165496555
-120.366561375147541
-110.403891471180892
-100.442125650692474
-90.479873982256154
-80.519110021355975
-70.560732381296181
-60.605286896599146
-50.651173518652785
-40.687261109444114
-30.712119617026077
-20.724418298869304
-10.723095154696557
00.708290117736514
10.6832799529677
20.645603399963093
30.601416820197678
40.561170257685698
50.526211750776637
60.494496789657503
70.466053640766634
80.4357554055989
90.404759633228641
100.369975453967108
110.339663310082494
120.315017484518996
130.292681114000377
140.276596315028451
150.264841600497668
160.252789354291837
170.243425098432089
180.243626930616505
190.243576939510522
200.241900629934842
210.239723259611653
220.238279031091977


Parameters (Session):
par1 = 1 ; par2 = 0 ; par3 = 0 ; par4 = 1 ; par5 = 1 ; par6 = 0 ; par7 = 0 ; par8 = na.fail ;
Parameters (R input):
par1 = 1 ; par2 = 0 ; par3 = 0 ; par4 = 1 ; par5 = 1 ; par6 = 0 ; par7 = 0 ; par8 = na.fail ;
R code (references can be found in the software module):
par1 <- as.numeric(par1)
par2 <- as.numeric(par2)
par3 <- as.numeric(par3)
par4 <- as.numeric(par4)
par5 <- as.numeric(par5)
par6 <- as.numeric(par6)
par7 <- as.numeric(par7)
if (par8=='na.fail') par8 <- na.fail else par8 <- na.pass
ccf <- function (x, y, lag.max = NULL, type = c('correlation', 'covariance'), plot = TRUE, na.action = na.fail, ...) {
type <- match.arg(type)
if (is.matrix(x) || is.matrix(y))
stop('univariate time series only')
X <- na.action(ts.intersect(as.ts(x), as.ts(y)))
colnames(X) <- c(deparse(substitute(x))[1L], deparse(substitute(y))[1L])
acf.out <- acf(X, lag.max = lag.max, plot = FALSE, type = type, na.action=na.action)
lag <- c(rev(acf.out$lag[-1, 2, 1]), acf.out$lag[, 1, 2])
y <- c(rev(acf.out$acf[-1, 2, 1]), acf.out$acf[, 1, 2])
acf.out$acf <- array(y, dim = c(length(y), 1L, 1L))
acf.out$lag <- array(lag, dim = c(length(y), 1L, 1L))
acf.out$snames <- paste(acf.out$snames, collapse = ' & ')
if (plot) {
plot(acf.out, ...)
return(invisible(acf.out))
}
else return(acf.out)
}
if (par1 == 0) {
x <- log(x)
} else {
x <- (x ^ par1 - 1) / par1
}
if (par5 == 0) {
y <- log(y)
} else {
y <- (y ^ par5 - 1) / par5
}
if (par2 > 0) x <- diff(x,lag=1,difference=par2)
if (par6 > 0) y <- diff(y,lag=1,difference=par6)
if (par3 > 0) x <- diff(x,lag=par4,difference=par3)
if (par7 > 0) y <- diff(y,lag=par4,difference=par7)
x
y
bitmap(file='test1.png')
(r <- ccf(x,y,na.action=par8,main='Cross Correlation Function',ylab='CCF',xlab='Lag (k)'))
dev.off()
load(file='createtable')
a<-table.start()
a<-table.row.start(a)
a<-table.element(a,'Cross Correlation Function',2,TRUE)
a<-table.row.end(a)
a<-table.row.start(a)
a<-table.element(a,'Parameter',header=TRUE)
a<-table.element(a,'Value',header=TRUE)
a<-table.row.end(a)
a<-table.row.start(a)
a<-table.element(a,'Box-Cox transformation parameter (lambda) of X series',header=TRUE)
a<-table.element(a,par1)
a<-table.row.end(a)
a<-table.row.start(a)
a<-table.element(a,'Degree of non-seasonal differencing (d) of X series',header=TRUE)
a<-table.element(a,par2)
a<-table.row.end(a)
a<-table.row.start(a)
a<-table.element(a,'Degree of seasonal differencing (D) of X series',header=TRUE)
a<-table.element(a,par3)
a<-table.row.end(a)
a<-table.row.start(a)
a<-table.element(a,'Seasonal Period (s)',header=TRUE)
a<-table.element(a,par4)
a<-table.row.end(a)
a<-table.row.start(a)
a<-table.element(a,'Box-Cox transformation parameter (lambda) of Y series',header=TRUE)
a<-table.element(a,par5)
a<-table.row.end(a)
a<-table.row.start(a)
a<-table.element(a,'Degree of non-seasonal differencing (d) of Y series',header=TRUE)
a<-table.element(a,par6)
a<-table.row.end(a)
a<-table.row.start(a)
a<-table.element(a,'Degree of seasonal differencing (D) of Y series',header=TRUE)
a<-table.element(a,par7)
a<-table.row.end(a)
a<-table.row.start(a)
a<-table.element(a,'k',header=TRUE)
a<-table.element(a,'rho(Y[t],X[t+k])',header=TRUE)
a<-table.row.end(a)
mylength <- length(r$acf)
myhalf <- floor((mylength-1)/2)
for (i in 1:mylength) {
a<-table.row.start(a)
a<-table.element(a,i-myhalf-1,header=TRUE)
a<-table.element(a,r$acf[i])
a<-table.row.end(a)
}
a<-table.end(a)
table.save(a,file='mytable.tab')