| Tabulation of Results | ||||
| hap x dep | ||||
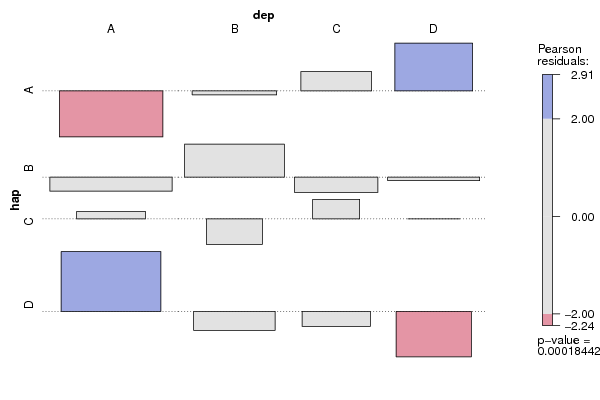
| A | B | C | D | A | 7 | 10 | 10 | 16 | B | 19 | 21 | 8 | 12 | C | 8 | 2 | 5 | 4 | D | 26 | 7 | 5 | 2 |
| Tabulation of Expected Results | ||||
| hap x dep | ||||
| A | B | C | D | A | 15.93 | 10.62 | 7.43 | 9.02 | B | 22.22 | 14.81 | 10.37 | 12.59 | C | 7.04 | 4.69 | 3.28 | 3.99 | D | 14.81 | 9.88 | 6.91 | 8.4 |
| Statistical Results | |
| Pearson's Chi-squared test with simulated p-value (based on 2000 replicates) | |
| Exact Pearson Chi Square Statistic | 32.19 |
| P value | 0 |