Free Statistics
of Irreproducible Research!
Description of Statistical Computation | |||||||||||||||||||||||||||||||||
|---|---|---|---|---|---|---|---|---|---|---|---|---|---|---|---|---|---|---|---|---|---|---|---|---|---|---|---|---|---|---|---|---|---|
| Author's title | |||||||||||||||||||||||||||||||||
| Author | *The author of this computation has been verified* | ||||||||||||||||||||||||||||||||
| R Software Module | rwasp_meanversusmedian.wasp | ||||||||||||||||||||||||||||||||
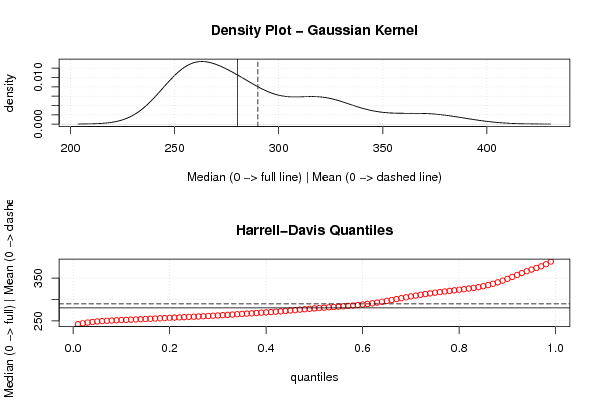
| Title produced by software | Mean versus Median | ||||||||||||||||||||||||||||||||
| Date of computation | Thu, 17 Nov 2011 09:53:54 -0500 | ||||||||||||||||||||||||||||||||
| Cite this page as follows | Statistical Computations at FreeStatistics.org, Office for Research Development and Education, URL https://freestatistics.org/blog/index.php?v=date/2011/Nov/17/t1321541987qq2ihel9k7284m3.htm/, Retrieved Thu, 25 Apr 2024 10:56:37 +0000 | ||||||||||||||||||||||||||||||||
| Statistical Computations at FreeStatistics.org, Office for Research Development and Education, URL https://freestatistics.org/blog/index.php?pk=144820, Retrieved Thu, 25 Apr 2024 10:56:37 +0000 | |||||||||||||||||||||||||||||||||
| QR Codes: | |||||||||||||||||||||||||||||||||
|
| |||||||||||||||||||||||||||||||||
| Original text written by user: | |||||||||||||||||||||||||||||||||
| IsPrivate? | No (this computation is public) | ||||||||||||||||||||||||||||||||
| User-defined keywords | |||||||||||||||||||||||||||||||||
| Estimated Impact | 89 | ||||||||||||||||||||||||||||||||
Tree of Dependent Computations | |||||||||||||||||||||||||||||||||
| Family? (F = Feedback message, R = changed R code, M = changed R Module, P = changed Parameters, D = changed Data) | |||||||||||||||||||||||||||||||||
| - [Mean versus Median] [Mean vs Median] [2011-11-17 14:53:54] [38f0c551da22b29428835e369961555f] [Current] | |||||||||||||||||||||||||||||||||
| Feedback Forum | |||||||||||||||||||||||||||||||||
Post a new message | |||||||||||||||||||||||||||||||||
Dataset | |||||||||||||||||||||||||||||||||
| Dataseries X: | |||||||||||||||||||||||||||||||||
255 280,2 299,9 339,2 374,2 393,5 389,2 381,7 375,2 369 357,4 352,1 346,5 342,9 340,3 328,3 322,9 314,3 308,9 294 285,6 281,2 280,3 278,8 274,5 270,4 263,4 259,9 258 262,7 284,7 311,3 322,1 327 331,3 333,3 321,4 327 320 314,7 316,7 314,4 321,3 318,2 307,2 301,3 287,5 277,7 274,4 258,8 253,3 251 248,4 249,5 246,1 244,5 243,6 244 240,8 249,8 248 259,4 260,5 260,8 261,3 259,5 256,6 257,9 256,5 254,2 253,3 253,8 255,5 257,1 257,3 253,2 252,8 252 250,7 252,2 250 251 253,4 251,2 255,6 261,1 258,9 259,9 261,2 264,7 267,1 266,4 267,7 268,6 267,5 268,5 268,5 270,5 270,9 270,1 269,3 269,8 270,1 264,9 263,7 264,8 263,7 255,9 276,2 360,1 380,5 373,7 369,8 366,6 359,3 345,8 326,2 324,5 328,1 327,5 324,4 316,5 310,9 301,5 291,7 290,4 287,4 277,7 281,6 288 276 272,9 283 283,3 276,8 284,5 282,7 281,2 287,4 283,1 284 285,5 289,2 292,5 296,4 305,2 303,9 311,5 316,3 | |||||||||||||||||||||||||||||||||
Tables (Output of Computation) | |||||||||||||||||||||||||||||||||
| |||||||||||||||||||||||||||||||||
Figures (Output of Computation) | |||||||||||||||||||||||||||||||||
Input Parameters & R Code | |||||||||||||||||||||||||||||||||
| Parameters (Session): | |||||||||||||||||||||||||||||||||
| Parameters (R input): | |||||||||||||||||||||||||||||||||
| R code (references can be found in the software module): | |||||||||||||||||||||||||||||||||
library(Hmisc) | |||||||||||||||||||||||||||||||||