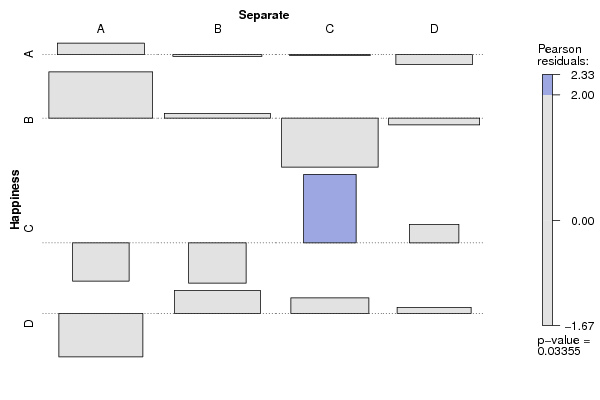
| Tabulation of Results | ||||
| Happiness x Separate | ||||
| A | B | C | D | A | 13 | 12 | 10 | 8 | B | 23 | 18 | 8 | 12 | C | 2 | 2 | 9 | 5 | D | 6 | 14 | 11 | 9 |
| Tabulation of Expected Results | ||||
| Happiness x Separate | ||||
| A | B | C | D | A | 11.68 | 12.21 | 10.09 | 9.02 | B | 16.57 | 17.32 | 14.31 | 12.8 | C | 4.89 | 5.11 | 4.22 | 3.78 | D | 10.86 | 11.36 | 9.38 | 8.4 |
| Statistical Results | |
| Pearson's Chi-squared test with simulated p-value (based on 2000 replicates) | |
| Exact Pearson Chi Square Statistic | 18.14 |
| P value | 0.03 |