Free Statistics

of Irreproducible Research!

Author's title

Author*The author of this computation has been verified*
R Software Modulerwasp_bootstrapplot.wasp
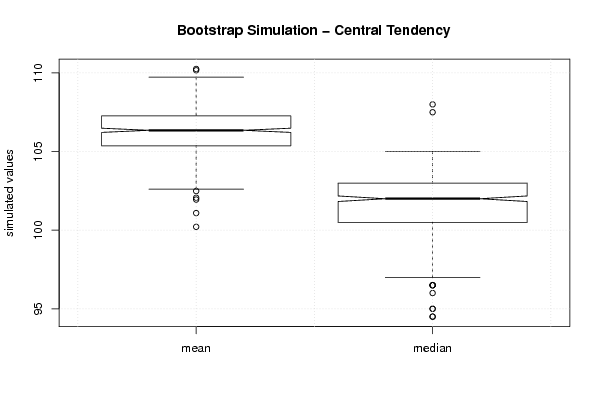
Title produced by softwareBlocked Bootstrap Plot - Central Tendency
Date of computationThu, 17 Nov 2011 09:19:24 -0500
Cite this page as followsStatistical Computations at FreeStatistics.org, Office for Research Development and Education, URL https://freestatistics.org/blog/index.php?v=date/2011/Nov/17/t1321539587i5kk9zd37y3mm95.htm/, Retrieved Fri, 19 Apr 2024 18:48:27 +0000
Statistical Computations at FreeStatistics.org, Office for Research Development and Education, URL https://freestatistics.org/blog/index.php?pk=144685, Retrieved Fri, 19 Apr 2024 18:48:27 +0000
QR Codes:

Original text written by user:
IsPrivate?No (this computation is public)
User-defined keywords
Estimated Impact75
Family? (F = Feedback message, R = changed R code, M = changed R Module, P = changed Parameters, D = changed Data)
-     [Bivariate Data Series] [Bivariate dataset] [2008-01-05 23:51:08] [74be16979710d4c4e7c6647856088456]
- RMPD  [Blocked Bootstrap Plot - Central Tendency] [Colombia Coffee] [2008-01-07 10:26:26] [74be16979710d4c4e7c6647856088456]
-  M D      [Blocked Bootstrap Plot - Central Tendency] [Blocked Bootstrap...] [2011-11-17 14:19:24] [e5e604418bec6ffe5109fb01f8a59ccb] [Current]
Feedback Forum

Post a new message
Dataseries X:
61
81
87
87
136
147
168
185
137
125
64
45
35
-4
88
85
95
128
186
182
151
106
60
44
30
54
72
88
153
168
181
180
149
84
85
42
54
30
96
110
141
159
164
155
135
93
28
56
56
22
76
83
121
151
208
179
139
99
103
57
44
70
58
91
126
146
199
194
145
131
74
-3
7
10
34
94
105
151
162
175
128
115
62
11
-7
64
80
77
127
158
173
206
147
103
73
52
52
68
77
94
147
160
166
167
155
104
44
53
56
36
76
99
142
150
190
176
175
112
73
52
48
61
68
97
146
160
155
175
163
117
82
55
32
48
53
82
139
150
184
185
138
147
77
32
48
72
76
94
133
164
174
187
149
102
86
35
31
28
75
102
133
178
190
190
147
83
83
46
40
50
61
102
117
158
170
190
155
117
68
40
56
28
66
103
122
166
176
164
160
139
75
44
22
32
42
86
140
163
222
166
183
140
98
69
75
63
81
126
139
171
170
173
144
105
75
41
68
53
61
87
155
159
180
175
138
105
73
26
12
35
64
115
138
138
182
191
155
113
98
29


Summary of computational transaction
Raw Inputview raw input (R code)
Raw Outputview raw output of R engine
Computing time1 seconds
R Server'AstonUniversity' @ aston.wessa.net

\begin{tabular}{lllllllll}
\hline
Summary of computational transaction \tabularnewline
Raw Input & view raw input (R code)  \tabularnewline
Raw Output & view raw output of R engine  \tabularnewline
Computing time & 1 seconds \tabularnewline
R Server & 'AstonUniversity' @ aston.wessa.net \tabularnewline
\hline
\end{tabular}
%Source: https://freestatistics.org/blog/index.php?pk=144685&T=0

[TABLE]
[ROW][C]Summary of computational transaction[/C][/ROW]
[ROW][C]Raw Input[/C][C]view raw input (R code) [/C][/ROW]
[ROW][C]Raw Output[/C][C]view raw output of R engine [/C][/ROW]
[ROW][C]Computing time[/C][C]1 seconds[/C][/ROW]
[ROW][C]R Server[/C][C]'AstonUniversity' @ aston.wessa.net[/C][/ROW]
[/TABLE]
Source: https://freestatistics.org/blog/index.php?pk=144685&T=0

Globally Unique Identifier (entire table): ba.freestatistics.org/blog/index.php?pk=144685&T=0

As an alternative you can also use a QR Code:  

The GUIDs for individual cells are displayed in the table below:

Summary of computational transaction
Raw Inputview raw input (R code)
Raw Outputview raw output of R engine
Computing time1 seconds
R Server'AstonUniversity' @ aston.wessa.net


Estimation Results of Blocked Bootstrap
statisticQ1EstimateQ3S.D.IQR
mean105.371875106.370833333333107.2666666666671.494770747940971.89479166666666
median100.51021031.904246914826242.5

\begin{tabular}{lllllllll}
\hline
Estimation Results of Blocked Bootstrap \tabularnewline
statistic & Q1 & Estimate & Q3 & S.D. & IQR \tabularnewline
mean & 105.371875 & 106.370833333333 & 107.266666666667 & 1.49477074794097 & 1.89479166666666 \tabularnewline
median & 100.5 & 102 & 103 & 1.90424691482624 & 2.5 \tabularnewline
\hline
\end{tabular}
%Source: https://freestatistics.org/blog/index.php?pk=144685&T=1

[TABLE]
[ROW][C]Estimation Results of Blocked Bootstrap[/C][/ROW]
[ROW][C]statistic[/C][C]Q1[/C][C]Estimate[/C][C]Q3[/C][C]S.D.[/C][C]IQR[/C][/ROW]
[ROW][C]mean[/C][C]105.371875[/C][C]106.370833333333[/C][C]107.266666666667[/C][C]1.49477074794097[/C][C]1.89479166666666[/C][/ROW]
[ROW][C]median[/C][C]100.5[/C][C]102[/C][C]103[/C][C]1.90424691482624[/C][C]2.5[/C][/ROW]
[/TABLE]
Source: https://freestatistics.org/blog/index.php?pk=144685&T=1

Globally Unique Identifier (entire table): ba.freestatistics.org/blog/index.php?pk=144685&T=1

As an alternative you can also use a QR Code:  

The GUIDs for individual cells are displayed in the table below:

Estimation Results of Blocked Bootstrap
statisticQ1EstimateQ3S.D.IQR
mean105.371875106.370833333333107.2666666666671.494770747940971.89479166666666
median100.51021031.904246914826242.5


95% Confidence Intervals
MeanMedian
Lower Bound106.217977019773101.823350629778
Upper Bound106.486189646894102.176649370222

\begin{tabular}{lllllllll}
\hline
95% Confidence Intervals \tabularnewline
 & Mean & Median \tabularnewline
Lower Bound & 106.217977019773 & 101.823350629778 \tabularnewline
Upper Bound & 106.486189646894 & 102.176649370222 \tabularnewline
\hline
\end{tabular}
%Source: https://freestatistics.org/blog/index.php?pk=144685&T=2

[TABLE]
[ROW][C]95% Confidence Intervals[/C][/ROW]
[ROW][C][/C][C]Mean[/C][C]Median[/C][/ROW]
[ROW][C]Lower Bound[/C][C]106.217977019773[/C][C]101.823350629778[/C][/ROW]
[ROW][C]Upper Bound[/C][C]106.486189646894[/C][C]102.176649370222[/C][/ROW]
[/TABLE]
Source: https://freestatistics.org/blog/index.php?pk=144685&T=2

Globally Unique Identifier (entire table): ba.freestatistics.org/blog/index.php?pk=144685&T=2

As an alternative you can also use a QR Code:  

The GUIDs for individual cells are displayed in the table below:

95% Confidence Intervals
MeanMedian
Lower Bound106.217977019773101.823350629778
Upper Bound106.486189646894102.176649370222


Parameters (Session):
par1 = 500 ; par2 = 12 ;
Parameters (R input):
par1 = 500 ; par2 = 12 ;
R code (references can be found in the software module):
par1 <- as.numeric(par1)
par2 <- as.numeric(par2)
if (par1 < 10) par1 = 10
if (par1 > 5000) par1 = 5000
if (par2 < 3) par2 = 3
if (par2 > length(x)) par2 = length(x)
library(lattice)
library(boot)
boot.stat <- function(s)
{
s.mean <- mean(s)
s.median <- median(s)
c(s.mean, s.median)
}
(r <- tsboot(x, boot.stat, R=par1, l=12, sim='fixed'))
z <- data.frame(cbind(r$t[,1],r$t[,2]))
colnames(z) <- list('mean','median')
bitmap(file='plot7.png')
b <- boxplot(z,notch=TRUE,ylab='simulated values',main='Bootstrap Simulation - Central Tendency')
grid()
dev.off()
b
load(file='createtable')
a<-table.start()
a<-table.row.start(a)
a<-table.element(a,'Estimation Results of Blocked Bootstrap',6,TRUE)
a<-table.row.end(a)
a<-table.row.start(a)
a<-table.element(a,'statistic',header=TRUE)
a<-table.element(a,'Q1',header=TRUE)
a<-table.element(a,'Estimate',header=TRUE)
a<-table.element(a,'Q3',header=TRUE)
a<-table.element(a,'S.D.',header=TRUE)
a<-table.element(a,'IQR',header=TRUE)
a<-table.row.end(a)
a<-table.row.start(a)
a<-table.element(a,'mean',header=TRUE)
q1 <- quantile(r$t[,1],0.25)[[1]]
q3 <- quantile(r$t[,1],0.75)[[1]]
a<-table.element(a,q1)
a<-table.element(a,r$t0[1])
a<-table.element(a,q3)
a<-table.element(a,sqrt(var(r$t[,1])))
a<-table.element(a,q3-q1)
a<-table.row.end(a)
a<-table.row.start(a)
a<-table.element(a,'median',header=TRUE)
q1 <- quantile(r$t[,2],0.25)[[1]]
q3 <- quantile(r$t[,2],0.75)[[1]]
a<-table.element(a,q1)
a<-table.element(a,r$t0[2])
a<-table.element(a,q3)
a<-table.element(a,sqrt(var(r$t[,2])))
a<-table.element(a,q3-q1)
a<-table.row.end(a)
a<-table.end(a)
table.save(a,file='mytable.tab')

a<-table.start()
a<-table.row.start(a)
a<-table.element(a,'95% Confidence Intervals',3,TRUE)
a<-table.row.end(a)
a<-table.row.start(a)
a<-table.element(a,'',1,TRUE)
a<-table.element(a,'Mean',1,TRUE)
a<-table.element(a,'Median',1,TRUE)
a<-table.row.end(a)
a<-table.row.start(a)
a<-table.element(a,'Lower Bound',1,TRUE)
a<-table.element(a,b$conf[1,1])
a<-table.element(a,b$conf[1,2])
a<-table.row.end(a)
a<-table.row.start(a)
a<-table.element(a,'Upper Bound',1,TRUE)
a<-table.element(a,b$conf[2,1])
a<-table.element(a,b$conf[2,2])
a<-table.row.end(a)
a<-table.end(a)
table.save(a,file='mytable1.tab')