| Tabulation of Results | ||
| Seperate x Connected | ||
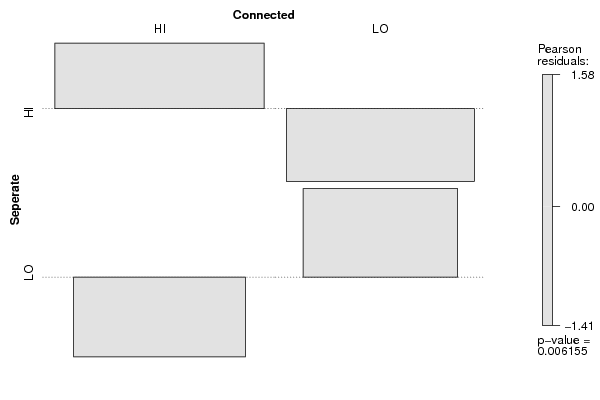
| HI | LO | HI | 61 | 34 | LO | 27 | 37 |
| Tabulation of Expected Results | ||
| Seperate x Connected | ||
| HI | LO | HI | 52.58 | 42.42 | LO | 35.42 | 28.58 |
| Statistical Results | |
| Pearson's Chi-squared test with Yates' continuity correction | |
| Pearson Chi Square Statistic | 6.64 |
| Degrees of Freedom | 1 |
| P value | 0.01 |