| Tabulation of Results | ||
| Age x Seperated | ||
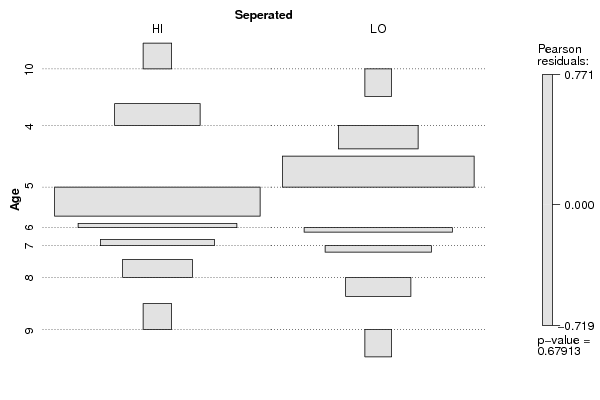
| HI | LO | 10 | 1 | 0 | 4 | 6 | 3 | 5 | 24 | 28 | 6 | 17 | 14 | 7 | 9 | 7 | 8 | 4 | 2 | 9 | 1 | 0 |
| Tabulation of Expected Results | ||
| Age x Seperated | ||
| HI | LO | 10 | 0.53 | 0.47 | 4 | 4.81 | 4.19 | 5 | 27.79 | 24.21 | 6 | 16.57 | 14.43 | 7 | 8.55 | 7.45 | 8 | 3.21 | 2.79 | 9 | 0.53 | 0.47 |
| Statistical Results | |
| Pearson's Chi-squared test | |
| Pearson Chi Square Statistic | 3.98 |
| Degrees of Freedom | 6 |
| P value | 0.68 |