| Tabulation of Results | ||
| Age x Connected | ||
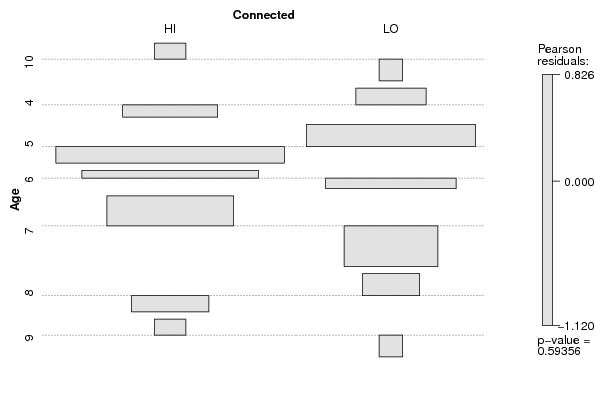
| HI | LO | 10 | 1 | 0 | 4 | 5 | 4 | 5 | 31 | 21 | 6 | 21 | 10 | 7 | 13 | 3 | 8 | 3 | 3 | 9 | 1 | 0 |
| Tabulation of Expected Results | ||
| Age x Connected | ||
| HI | LO | 10 | 0.65 | 0.35 | 4 | 5.82 | 3.18 | 5 | 33.62 | 18.38 | 6 | 20.04 | 10.96 | 7 | 10.34 | 5.66 | 8 | 3.88 | 2.12 | 9 | 0.65 | 0.35 |
| Statistical Results | |
| Pearson's Chi-squared test | |
| Pearson Chi Square Statistic | 4.62 |
| Degrees of Freedom | 6 |
| P value | 0.59 |