| Tabulation of Results | ||
| Age x Depression | ||
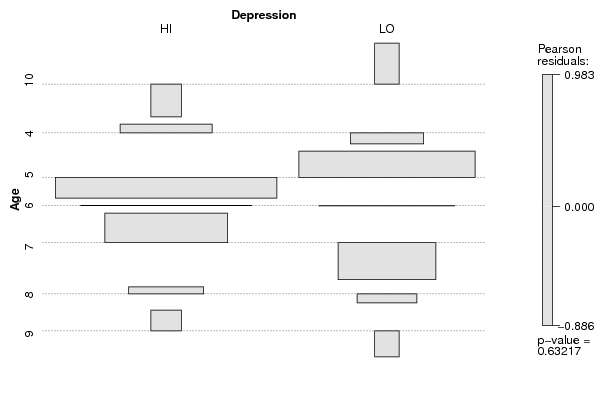
| HI | LO | 10 | 0 | 1 | 4 | 6 | 3 | 5 | 29 | 23 | 6 | 19 | 12 | 7 | 12 | 4 | 8 | 4 | 2 | 9 | 1 | 0 |
| Tabulation of Expected Results | ||
| Age x Depression | ||
| HI | LO | 10 | 0.61 | 0.39 | 4 | 5.51 | 3.49 | 5 | 31.83 | 20.17 | 6 | 18.97 | 12.03 | 7 | 9.79 | 6.21 | 8 | 3.67 | 2.33 | 9 | 0.61 | 0.39 |
| Statistical Results | |
| Pearson's Chi-squared test | |
| Pearson Chi Square Statistic | 4.33 |
| Degrees of Freedom | 6 |
| P value | 0.63 |