| Tabulation of Results | ||
| Happiness x Depression | ||
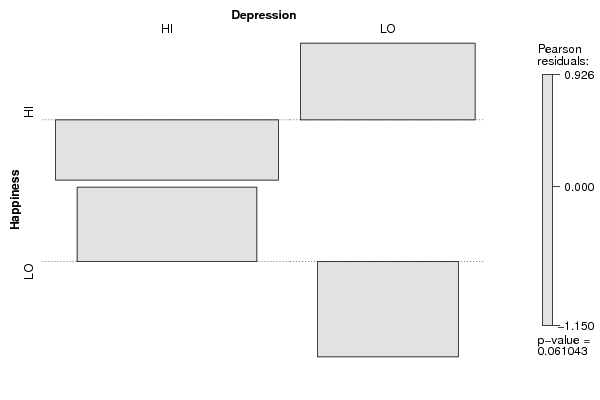
| HI | LO | HI | 48 | 38 | LO | 40 | 16 |
| Tabulation of Expected Results | ||
| Happiness x Depression | ||
| HI | LO | HI | 53.3 | 32.7 | LO | 34.7 | 21.3 |
| Statistical Results | |
| Pearson's Chi-squared test with Yates' continuity correction | |
| Pearson Chi Square Statistic | 2.88 |
| Degrees of Freedom | 1 |
| P value | 0.09 |