| Tabulation of Results | |||||||||||||||||
| Happiness x Depression | |||||||||||||||||
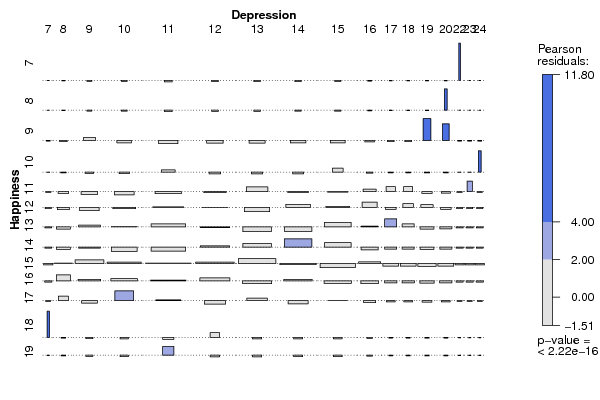
| 7 | 8 | 9 | 10 | 11 | 12 | 13 | 14 | 15 | 16 | 17 | 18 | 19 | 20 | 22 | 23 | 24 | 7 | 0 | 0 | 0 | 0 | 0 | 0 | 0 | 0 | 0 | 0 | 0 | 0 | 0 | 0 | 1 | 0 | 0 | 8 | 0 | 0 | 0 | 0 | 0 | 0 | 0 | 0 | 0 | 0 | 0 | 0 | 0 | 1 | 0 | 0 | 0 | 9 | 0 | 0 | 1 | 0 | 0 | 0 | 0 | 0 | 0 | 0 | 0 | 0 | 3 | 2 | 0 | 0 | 0 | 10 | 0 | 0 | 0 | 0 | 1 | 0 | 0 | 0 | 1 | 0 | 0 | 0 | 0 | 0 | 0 | 0 | 1 | 11 | 0 | 0 | 0 | 0 | 1 | 1 | 3 | 1 | 1 | 1 | 1 | 1 | 0 | 0 | 0 | 1 | 0 | 12 | 0 | 0 | 0 | 1 | 3 | 2 | 0 | 3 | 2 | 2 | 0 | 1 | 1 | 0 | 0 | 0 | 0 | 13 | 0 | 0 | 2 | 2 | 5 | 2 | 0 | 0 | 4 | 1 | 2 | 1 | 0 | 0 | 0 | 0 | 0 | 14 | 0 | 0 | 1 | 0 | 1 | 3 | 4 | 6 | 4 | 0 | 0 | 0 | 0 | 0 | 0 | 0 | 0 | 15 | 0 | 1 | 4 | 4 | 6 | 5 | 7 | 3 | 1 | 2 | 0 | 0 | 0 | 0 | 0 | 0 | 0 | 16 | 0 | 2 | 2 | 3 | 4 | 4 | 1 | 3 | 1 | 0 | 0 | 0 | 0 | 0 | 0 | 0 | 0 | 17 | 0 | 1 | 0 | 4 | 2 | 0 | 2 | 0 | 1 | 0 | 0 | 0 | 0 | 0 | 0 | 0 | 0 | 18 | 1 | 0 | 0 | 0 | 0 | 1 | 0 | 0 | 0 | 0 | 0 | 0 | 0 | 0 | 0 | 0 | 0 | 19 | 0 | 0 | 0 | 0 | 2 | 0 | 0 | 0 | 0 | 0 | 0 | 0 | 0 | 0 | 0 | 0 | 0 |
| Tabulation of Expected Results | |||||||||||||||||
| Happiness x Depression | |||||||||||||||||
| 7 | 8 | 9 | 10 | 11 | 12 | 13 | 14 | 15 | 16 | 17 | 18 | 19 | 20 | 22 | 23 | 24 | 7 | 0.01 | 0.03 | 0.07 | 0.1 | 0.18 | 0.13 | 0.12 | 0.11 | 0.11 | 0.04 | 0.02 | 0.02 | 0.03 | 0.02 | 0.01 | 0.01 | 0.01 | 8 | 0.01 | 0.03 | 0.07 | 0.1 | 0.18 | 0.13 | 0.12 | 0.11 | 0.11 | 0.04 | 0.02 | 0.02 | 0.03 | 0.02 | 0.01 | 0.01 | 0.01 | 9 | 0.04 | 0.17 | 0.42 | 0.59 | 1.06 | 0.76 | 0.72 | 0.68 | 0.63 | 0.25 | 0.13 | 0.13 | 0.17 | 0.13 | 0.04 | 0.04 | 0.04 | 10 | 0.02 | 0.08 | 0.21 | 0.3 | 0.53 | 0.38 | 0.36 | 0.34 | 0.32 | 0.13 | 0.06 | 0.06 | 0.08 | 0.06 | 0.02 | 0.02 | 0.02 | 11 | 0.08 | 0.31 | 0.77 | 1.08 | 1.94 | 1.39 | 1.32 | 1.24 | 1.16 | 0.46 | 0.23 | 0.23 | 0.31 | 0.23 | 0.08 | 0.08 | 0.08 | 12 | 0.11 | 0.42 | 1.06 | 1.48 | 2.64 | 1.9 | 1.8 | 1.69 | 1.58 | 0.63 | 0.32 | 0.32 | 0.42 | 0.32 | 0.11 | 0.11 | 0.11 | 13 | 0.13 | 0.54 | 1.34 | 1.87 | 3.35 | 2.41 | 2.27 | 2.14 | 2.01 | 0.8 | 0.4 | 0.4 | 0.54 | 0.4 | 0.13 | 0.13 | 0.13 | 14 | 0.13 | 0.54 | 1.34 | 1.87 | 3.35 | 2.41 | 2.27 | 2.14 | 2.01 | 0.8 | 0.4 | 0.4 | 0.54 | 0.4 | 0.13 | 0.13 | 0.13 | 15 | 0.23 | 0.93 | 2.32 | 3.25 | 5.81 | 4.18 | 3.95 | 3.72 | 3.49 | 1.39 | 0.7 | 0.7 | 0.93 | 0.7 | 0.23 | 0.23 | 0.23 | 16 | 0.14 | 0.56 | 1.41 | 1.97 | 3.52 | 2.54 | 2.39 | 2.25 | 2.11 | 0.85 | 0.42 | 0.42 | 0.56 | 0.42 | 0.14 | 0.14 | 0.14 | 17 | 0.07 | 0.28 | 0.7 | 0.99 | 1.76 | 1.27 | 1.2 | 1.13 | 1.06 | 0.42 | 0.21 | 0.21 | 0.28 | 0.21 | 0.07 | 0.07 | 0.07 | 18 | 0.01 | 0.06 | 0.14 | 0.2 | 0.35 | 0.25 | 0.24 | 0.23 | 0.21 | 0.08 | 0.04 | 0.04 | 0.06 | 0.04 | 0.01 | 0.01 | 0.01 | 19 | 0.01 | 0.06 | 0.14 | 0.2 | 0.35 | 0.25 | 0.24 | 0.23 | 0.21 | 0.08 | 0.04 | 0.04 | 0.06 | 0.04 | 0.01 | 0.01 | 0.01 |
| Statistical Results | |
| Pearson's Chi-squared test | |
| Pearson Chi Square Statistic | 504.62 |
| Degrees of Freedom | 192 |
| P value | 0 |