Free Statistics

of Irreproducible Research!

Author's title

Author*Unverified author*
R Software Modulerwasp_autocorrelation.wasp
Title produced by software(Partial) Autocorrelation Function
Date of computationWed, 16 Nov 2011 16:15:07 -0500
Cite this page as followsStatistical Computations at FreeStatistics.org, Office for Research Development and Education, URL https://freestatistics.org/blog/index.php?v=date/2011/Nov/16/t1321478143tebotljqjx33o2w.htm/, Retrieved Thu, 25 Apr 2024 06:53:10 +0000
Statistical Computations at FreeStatistics.org, Office for Research Development and Education, URL https://freestatistics.org/blog/index.php?pk=144222, Retrieved Thu, 25 Apr 2024 06:53:10 +0000
QR Codes:

Original text written by user:
IsPrivate?No (this computation is public)
User-defined keywordsKDGP2W12
Estimated Impact96
Family? (F = Feedback message, R = changed R code, M = changed R Module, P = changed Parameters, D = changed Data)
-       [(Partial) Autocorrelation Function] [] [2011-11-16 21:15:07] [25bd055699d3ffa05f522cc79bb2ff75] [Current]
Feedback Forum

Post a new message
Dataseries X:
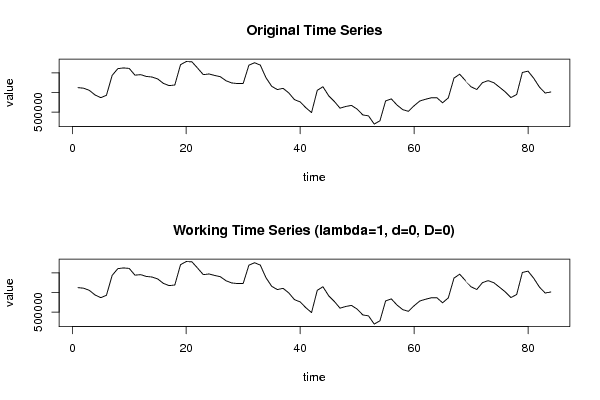
562325
560854
555332
543599
536662
542722
593530
610763
612613
611324
594167
595454
590865
589379
584428
573100
567456
569028
620735
628884
628232
612117
595404
597141
593408
590072
579799
574205
572775
572942
619567
625809
619916
587625
565742
557274
560576
548854
531673
525919
511038
498662
555362
564591
541657
527070
509846
514258
516922
507561
492622
490243
469357
477580
528379
533590
517945
506174
501866
516141
528222
532638
536322
536535
523597
536214
586570
596594
580523
564478
557560
575093
580112
574761
563250
551531
537034
544686
600991
604378
586111
563668
548604
551174


Summary of computational transaction
Raw Inputview raw input (R code)
Raw Outputview raw output of R engine
Computing time2 seconds
R Server'George Udny Yule' @ yule.wessa.net

\begin{tabular}{lllllllll}
\hline
Summary of computational transaction \tabularnewline
Raw Input & view raw input (R code)  \tabularnewline
Raw Output & view raw output of R engine  \tabularnewline
Computing time & 2 seconds \tabularnewline
R Server & 'George Udny Yule' @ yule.wessa.net \tabularnewline
\hline
\end{tabular}
%Source: https://freestatistics.org/blog/index.php?pk=144222&T=0

[TABLE]
[ROW][C]Summary of computational transaction[/C][/ROW]
[ROW][C]Raw Input[/C][C]view raw input (R code) [/C][/ROW]
[ROW][C]Raw Output[/C][C]view raw output of R engine [/C][/ROW]
[ROW][C]Computing time[/C][C]2 seconds[/C][/ROW]
[ROW][C]R Server[/C][C]'George Udny Yule' @ yule.wessa.net[/C][/ROW]
[/TABLE]
Source: https://freestatistics.org/blog/index.php?pk=144222&T=0

Globally Unique Identifier (entire table): ba.freestatistics.org/blog/index.php?pk=144222&T=0

As an alternative you can also use a QR Code:  

The GUIDs for individual cells are displayed in the table below:

Summary of computational transaction
Raw Inputview raw input (R code)
Raw Outputview raw output of R engine
Computing time2 seconds
R Server'George Udny Yule' @ yule.wessa.net


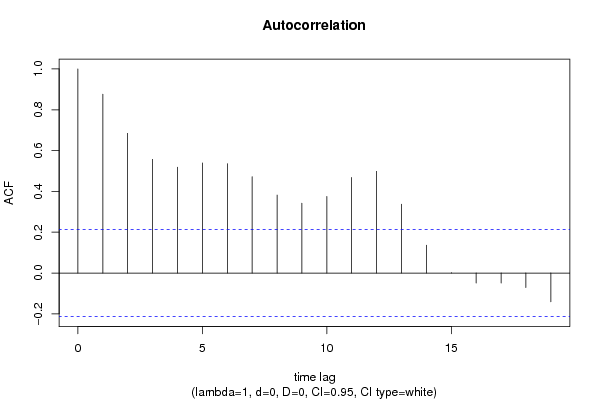
Autocorrelation Function
Time lag kACF(k)T-STATP-value
10.8761358.02990
20.6843116.27180
30.5569765.10481e-06
40.517984.74744e-06
50.5393284.9432e-06
60.5356354.90922e-06
70.472194.32772.1e-05
80.3818793.50.000374
90.341793.13260.001193
100.375373.44030.000454
110.4678064.28752.4e-05
120.4981724.56588e-06
130.3372433.09090.001354
140.1359021.24560.108194
150.0014880.01360.494574
16-0.049241-0.45130.326467
17-0.048758-0.44690.328058
18-0.071441-0.65480.257203
19-0.140621-1.28880.100501

\begin{tabular}{lllllllll}
\hline
Autocorrelation Function \tabularnewline
Time lag k & ACF(k) & T-STAT & P-value \tabularnewline
1 & 0.876135 & 8.0299 & 0 \tabularnewline
2 & 0.684311 & 6.2718 & 0 \tabularnewline
3 & 0.556976 & 5.1048 & 1e-06 \tabularnewline
4 & 0.51798 & 4.7474 & 4e-06 \tabularnewline
5 & 0.539328 & 4.943 & 2e-06 \tabularnewline
6 & 0.535635 & 4.9092 & 2e-06 \tabularnewline
7 & 0.47219 & 4.3277 & 2.1e-05 \tabularnewline
8 & 0.381879 & 3.5 & 0.000374 \tabularnewline
9 & 0.34179 & 3.1326 & 0.001193 \tabularnewline
10 & 0.37537 & 3.4403 & 0.000454 \tabularnewline
11 & 0.467806 & 4.2875 & 2.4e-05 \tabularnewline
12 & 0.498172 & 4.5658 & 8e-06 \tabularnewline
13 & 0.337243 & 3.0909 & 0.001354 \tabularnewline
14 & 0.135902 & 1.2456 & 0.108194 \tabularnewline
15 & 0.001488 & 0.0136 & 0.494574 \tabularnewline
16 & -0.049241 & -0.4513 & 0.326467 \tabularnewline
17 & -0.048758 & -0.4469 & 0.328058 \tabularnewline
18 & -0.071441 & -0.6548 & 0.257203 \tabularnewline
19 & -0.140621 & -1.2888 & 0.100501 \tabularnewline
\hline
\end{tabular}
%Source: https://freestatistics.org/blog/index.php?pk=144222&T=1

[TABLE]
[ROW][C]Autocorrelation Function[/C][/ROW]
[ROW][C]Time lag k[/C][C]ACF(k)[/C][C]T-STAT[/C][C]P-value[/C][/ROW]
[ROW][C]1[/C][C]0.876135[/C][C]8.0299[/C][C]0[/C][/ROW]
[ROW][C]2[/C][C]0.684311[/C][C]6.2718[/C][C]0[/C][/ROW]
[ROW][C]3[/C][C]0.556976[/C][C]5.1048[/C][C]1e-06[/C][/ROW]
[ROW][C]4[/C][C]0.51798[/C][C]4.7474[/C][C]4e-06[/C][/ROW]
[ROW][C]5[/C][C]0.539328[/C][C]4.943[/C][C]2e-06[/C][/ROW]
[ROW][C]6[/C][C]0.535635[/C][C]4.9092[/C][C]2e-06[/C][/ROW]
[ROW][C]7[/C][C]0.47219[/C][C]4.3277[/C][C]2.1e-05[/C][/ROW]
[ROW][C]8[/C][C]0.381879[/C][C]3.5[/C][C]0.000374[/C][/ROW]
[ROW][C]9[/C][C]0.34179[/C][C]3.1326[/C][C]0.001193[/C][/ROW]
[ROW][C]10[/C][C]0.37537[/C][C]3.4403[/C][C]0.000454[/C][/ROW]
[ROW][C]11[/C][C]0.467806[/C][C]4.2875[/C][C]2.4e-05[/C][/ROW]
[ROW][C]12[/C][C]0.498172[/C][C]4.5658[/C][C]8e-06[/C][/ROW]
[ROW][C]13[/C][C]0.337243[/C][C]3.0909[/C][C]0.001354[/C][/ROW]
[ROW][C]14[/C][C]0.135902[/C][C]1.2456[/C][C]0.108194[/C][/ROW]
[ROW][C]15[/C][C]0.001488[/C][C]0.0136[/C][C]0.494574[/C][/ROW]
[ROW][C]16[/C][C]-0.049241[/C][C]-0.4513[/C][C]0.326467[/C][/ROW]
[ROW][C]17[/C][C]-0.048758[/C][C]-0.4469[/C][C]0.328058[/C][/ROW]
[ROW][C]18[/C][C]-0.071441[/C][C]-0.6548[/C][C]0.257203[/C][/ROW]
[ROW][C]19[/C][C]-0.140621[/C][C]-1.2888[/C][C]0.100501[/C][/ROW]
[/TABLE]
Source: https://freestatistics.org/blog/index.php?pk=144222&T=1

Globally Unique Identifier (entire table): ba.freestatistics.org/blog/index.php?pk=144222&T=1

As an alternative you can also use a QR Code:  

The GUIDs for individual cells are displayed in the table below:

Autocorrelation Function
Time lag kACF(k)T-STATP-value
10.8761358.02990
20.6843116.27180
30.5569765.10481e-06
40.517984.74744e-06
50.5393284.9432e-06
60.5356354.90922e-06
70.472194.32772.1e-05
80.3818793.50.000374
90.341793.13260.001193
100.375373.44030.000454
110.4678064.28752.4e-05
120.4981724.56588e-06
130.3372433.09090.001354
140.1359021.24560.108194
150.0014880.01360.494574
16-0.049241-0.45130.326467
17-0.048758-0.44690.328058
18-0.071441-0.65480.257203
19-0.140621-1.28880.100501


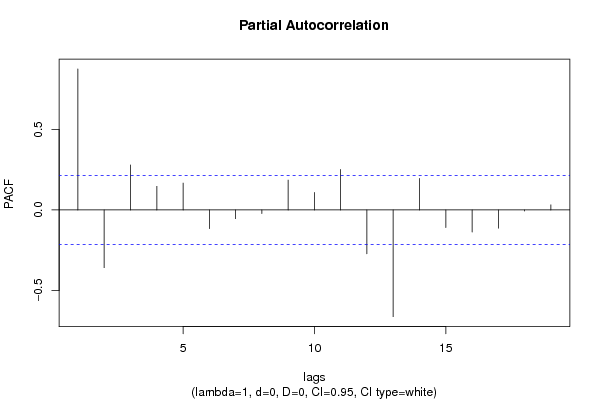
Partial Autocorrelation Function
Time lag kPACF(k)T-STATP-value
10.8761358.02990
2-0.358454-3.28530.000744
30.2793212.560.006128
40.1465991.34360.091348
50.1666221.52710.065244
6-0.11599-1.06310.145399
7-0.054266-0.49740.310119
8-0.0225-0.20620.41856
90.1853641.69890.046521
100.1083920.99340.161677
110.2515012.3050.011815
12-0.272157-2.49440.007289
13-0.66319-6.07820
140.1952351.78940.03858
15-0.109531-1.00390.159163
16-0.137296-1.25830.105878
17-0.113223-1.03770.151192
18-0.00665-0.0610.475772
190.0313550.28740.387268

\begin{tabular}{lllllllll}
\hline
Partial Autocorrelation Function \tabularnewline
Time lag k & PACF(k) & T-STAT & P-value \tabularnewline
1 & 0.876135 & 8.0299 & 0 \tabularnewline
2 & -0.358454 & -3.2853 & 0.000744 \tabularnewline
3 & 0.279321 & 2.56 & 0.006128 \tabularnewline
4 & 0.146599 & 1.3436 & 0.091348 \tabularnewline
5 & 0.166622 & 1.5271 & 0.065244 \tabularnewline
6 & -0.11599 & -1.0631 & 0.145399 \tabularnewline
7 & -0.054266 & -0.4974 & 0.310119 \tabularnewline
8 & -0.0225 & -0.2062 & 0.41856 \tabularnewline
9 & 0.185364 & 1.6989 & 0.046521 \tabularnewline
10 & 0.108392 & 0.9934 & 0.161677 \tabularnewline
11 & 0.251501 & 2.305 & 0.011815 \tabularnewline
12 & -0.272157 & -2.4944 & 0.007289 \tabularnewline
13 & -0.66319 & -6.0782 & 0 \tabularnewline
14 & 0.195235 & 1.7894 & 0.03858 \tabularnewline
15 & -0.109531 & -1.0039 & 0.159163 \tabularnewline
16 & -0.137296 & -1.2583 & 0.105878 \tabularnewline
17 & -0.113223 & -1.0377 & 0.151192 \tabularnewline
18 & -0.00665 & -0.061 & 0.475772 \tabularnewline
19 & 0.031355 & 0.2874 & 0.387268 \tabularnewline
\hline
\end{tabular}
%Source: https://freestatistics.org/blog/index.php?pk=144222&T=2

[TABLE]
[ROW][C]Partial Autocorrelation Function[/C][/ROW]
[ROW][C]Time lag k[/C][C]PACF(k)[/C][C]T-STAT[/C][C]P-value[/C][/ROW]
[ROW][C]1[/C][C]0.876135[/C][C]8.0299[/C][C]0[/C][/ROW]
[ROW][C]2[/C][C]-0.358454[/C][C]-3.2853[/C][C]0.000744[/C][/ROW]
[ROW][C]3[/C][C]0.279321[/C][C]2.56[/C][C]0.006128[/C][/ROW]
[ROW][C]4[/C][C]0.146599[/C][C]1.3436[/C][C]0.091348[/C][/ROW]
[ROW][C]5[/C][C]0.166622[/C][C]1.5271[/C][C]0.065244[/C][/ROW]
[ROW][C]6[/C][C]-0.11599[/C][C]-1.0631[/C][C]0.145399[/C][/ROW]
[ROW][C]7[/C][C]-0.054266[/C][C]-0.4974[/C][C]0.310119[/C][/ROW]
[ROW][C]8[/C][C]-0.0225[/C][C]-0.2062[/C][C]0.41856[/C][/ROW]
[ROW][C]9[/C][C]0.185364[/C][C]1.6989[/C][C]0.046521[/C][/ROW]
[ROW][C]10[/C][C]0.108392[/C][C]0.9934[/C][C]0.161677[/C][/ROW]
[ROW][C]11[/C][C]0.251501[/C][C]2.305[/C][C]0.011815[/C][/ROW]
[ROW][C]12[/C][C]-0.272157[/C][C]-2.4944[/C][C]0.007289[/C][/ROW]
[ROW][C]13[/C][C]-0.66319[/C][C]-6.0782[/C][C]0[/C][/ROW]
[ROW][C]14[/C][C]0.195235[/C][C]1.7894[/C][C]0.03858[/C][/ROW]
[ROW][C]15[/C][C]-0.109531[/C][C]-1.0039[/C][C]0.159163[/C][/ROW]
[ROW][C]16[/C][C]-0.137296[/C][C]-1.2583[/C][C]0.105878[/C][/ROW]
[ROW][C]17[/C][C]-0.113223[/C][C]-1.0377[/C][C]0.151192[/C][/ROW]
[ROW][C]18[/C][C]-0.00665[/C][C]-0.061[/C][C]0.475772[/C][/ROW]
[ROW][C]19[/C][C]0.031355[/C][C]0.2874[/C][C]0.387268[/C][/ROW]
[/TABLE]
Source: https://freestatistics.org/blog/index.php?pk=144222&T=2

Globally Unique Identifier (entire table): ba.freestatistics.org/blog/index.php?pk=144222&T=2

As an alternative you can also use a QR Code:  

The GUIDs for individual cells are displayed in the table below:

Partial Autocorrelation Function
Time lag kPACF(k)T-STATP-value
10.8761358.02990
2-0.358454-3.28530.000744
30.2793212.560.006128
40.1465991.34360.091348
50.1666221.52710.065244
6-0.11599-1.06310.145399
7-0.054266-0.49740.310119
8-0.0225-0.20620.41856
90.1853641.69890.046521
100.1083920.99340.161677
110.2515012.3050.011815
12-0.272157-2.49440.007289
13-0.66319-6.07820
140.1952351.78940.03858
15-0.109531-1.00390.159163
16-0.137296-1.25830.105878
17-0.113223-1.03770.151192
18-0.00665-0.0610.475772
190.0313550.28740.387268


Parameters (Session):
par1 = Default ; par2 = 1 ; par3 = 0 ; par4 = 0 ; par5 = 12 ; par6 = White Noise ; par7 = 0.95 ;
Parameters (R input):
par1 = Default ; par2 = 1 ; par3 = 0 ; par4 = 0 ; par5 = 12 ; par6 = White Noise ; par7 = 0.95 ; par8 = ;
R code (references can be found in the software module):
if (par1 == 'Default') {
par1 = 10*log10(length(x))
} else {
par1 <- as.numeric(par1)
}
par2 <- as.numeric(par2)
par3 <- as.numeric(par3)
par4 <- as.numeric(par4)
par5 <- as.numeric(par5)
if (par6 == 'White Noise') par6 <- 'white' else par6 <- 'ma'
par7 <- as.numeric(par7)
if (par8 != '') par8 <- as.numeric(par8)
ox <- x
if (par8 == '') {
if (par2 == 0) {
x <- log(x)
} else {
x <- (x ^ par2 - 1) / par2
}
} else {
x <- log(x,base=par8)
}
if (par3 > 0) x <- diff(x,lag=1,difference=par3)
if (par4 > 0) x <- diff(x,lag=par5,difference=par4)
bitmap(file='picts.png')
op <- par(mfrow=c(2,1))
plot(ox,type='l',main='Original Time Series',xlab='time',ylab='value')
if (par8=='') {
mytitle <- paste('Working Time Series (lambda=',par2,', d=',par3,', D=',par4,')',sep='')
mysub <- paste('(lambda=',par2,', d=',par3,', D=',par4,', CI=', par7, ', CI type=',par6,')',sep='')
} else {
mytitle <- paste('Working Time Series (base=',par8,', d=',par3,', D=',par4,')',sep='')
mysub <- paste('(base=',par8,', d=',par3,', D=',par4,', CI=', par7, ', CI type=',par6,')',sep='')
}
plot(x,type='l', main=mytitle,xlab='time',ylab='value')
par(op)
dev.off()
bitmap(file='pic1.png')
racf <- acf(x, par1, main='Autocorrelation', xlab='time lag', ylab='ACF', ci.type=par6, ci=par7, sub=mysub)
dev.off()
bitmap(file='pic2.png')
rpacf <- pacf(x,par1,main='Partial Autocorrelation',xlab='lags',ylab='PACF',sub=mysub)
dev.off()
(myacf <- c(racf$acf))
(mypacf <- c(rpacf$acf))
lengthx <- length(x)
sqrtn <- sqrt(lengthx)
load(file='createtable')
a<-table.start()
a<-table.row.start(a)
a<-table.element(a,'Autocorrelation Function',4,TRUE)
a<-table.row.end(a)
a<-table.row.start(a)
a<-table.element(a,'Time lag k',header=TRUE)
a<-table.element(a,hyperlink('basics.htm','ACF(k)','click here for more information about the Autocorrelation Function'),header=TRUE)
a<-table.element(a,'T-STAT',header=TRUE)
a<-table.element(a,'P-value',header=TRUE)
a<-table.row.end(a)
for (i in 2:(par1+1)) {
a<-table.row.start(a)
a<-table.element(a,i-1,header=TRUE)
a<-table.element(a,round(myacf[i],6))
mytstat <- myacf[i]*sqrtn
a<-table.element(a,round(mytstat,4))
a<-table.element(a,round(1-pt(abs(mytstat),lengthx),6))
a<-table.row.end(a)
}
a<-table.end(a)
table.save(a,file='mytable.tab')
a<-table.start()
a<-table.row.start(a)
a<-table.element(a,'Partial Autocorrelation Function',4,TRUE)
a<-table.row.end(a)
a<-table.row.start(a)
a<-table.element(a,'Time lag k',header=TRUE)
a<-table.element(a,hyperlink('basics.htm','PACF(k)','click here for more information about the Partial Autocorrelation Function'),header=TRUE)
a<-table.element(a,'T-STAT',header=TRUE)
a<-table.element(a,'P-value',header=TRUE)
a<-table.row.end(a)
for (i in 1:par1) {
a<-table.row.start(a)
a<-table.element(a,i,header=TRUE)
a<-table.element(a,round(mypacf[i],6))
mytstat <- mypacf[i]*sqrtn
a<-table.element(a,round(mytstat,4))
a<-table.element(a,round(1-pt(abs(mytstat),lengthx),6))
a<-table.row.end(a)
}
a<-table.end(a)
table.save(a,file='mytable1.tab')