Free Statistics

of Irreproducible Research!

Author's title

Author*Unverified author*
R Software Modulerwasp_autocorrelation.wasp
Title produced by software(Partial) Autocorrelation Function
Date of computationWed, 16 Nov 2011 15:50:21 -0500
Cite this page as followsStatistical Computations at FreeStatistics.org, Office for Research Development and Education, URL https://freestatistics.org/blog/index.php?v=date/2011/Nov/16/t1321476722qijzd0doniy0ba5.htm/, Retrieved Fri, 19 Apr 2024 13:55:36 +0000
Statistical Computations at FreeStatistics.org, Office for Research Development and Education, URL https://freestatistics.org/blog/index.php?pk=144206, Retrieved Fri, 19 Apr 2024 13:55:36 +0000
QR Codes:

Original text written by user:
IsPrivate?No (this computation is public)
User-defined keywordsKDGP2W12
Estimated Impact80
Family? (F = Feedback message, R = changed R code, M = changed R Module, P = changed Parameters, D = changed Data)
-       [(Partial) Autocorrelation Function] [] [2011-11-16 20:50:21] [307fb8dee51f98edb4f1db3243dd69bf] [Current]
Feedback Forum

Post a new message
Dataseries X:
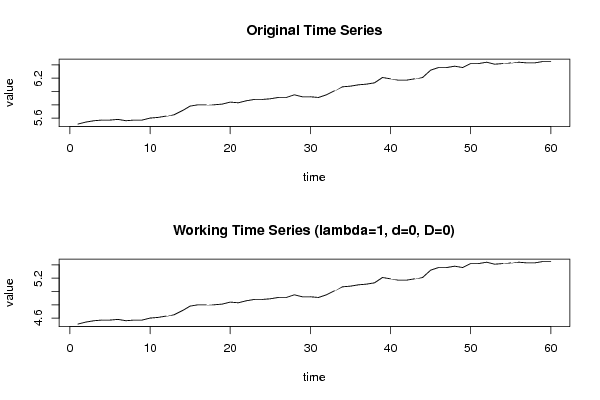
5,51
5,54
5,56
5,57
5,57
5,58
5,56
5,57
5,57
5,6
5,61
5,63
5,65
5,71
5,78
5,8
5,8
5,8
5,81
5,84
5,83
5,86
5,88
5,88
5,89
5,91
5,91
5,95
5,92
5,92
5,91
5,95
6,01
6,07
6,08
6,1
6,11
6,13
6,21
6,19
6,17
6,17
6,19
6,21
6,32
6,36
6,36
6,38
6,36
6,42
6,42
6,44
6,41
6,42
6,43
6,44
6,43
6,43
6,45
6,45


Summary of computational transaction
Raw Inputview raw input (R code)
Raw Outputview raw output of R engine
Computing time1 seconds
R Server'Herman Ole Andreas Wold' @ wold.wessa.net

\begin{tabular}{lllllllll}
\hline
Summary of computational transaction \tabularnewline
Raw Input & view raw input (R code)  \tabularnewline
Raw Output & view raw output of R engine  \tabularnewline
Computing time & 1 seconds \tabularnewline
R Server & 'Herman Ole Andreas Wold' @ wold.wessa.net \tabularnewline
\hline
\end{tabular}
%Source: https://freestatistics.org/blog/index.php?pk=144206&T=0

[TABLE]
[ROW][C]Summary of computational transaction[/C][/ROW]
[ROW][C]Raw Input[/C][C]view raw input (R code) [/C][/ROW]
[ROW][C]Raw Output[/C][C]view raw output of R engine [/C][/ROW]
[ROW][C]Computing time[/C][C]1 seconds[/C][/ROW]
[ROW][C]R Server[/C][C]'Herman Ole Andreas Wold' @ wold.wessa.net[/C][/ROW]
[/TABLE]
Source: https://freestatistics.org/blog/index.php?pk=144206&T=0

Globally Unique Identifier (entire table): ba.freestatistics.org/blog/index.php?pk=144206&T=0

As an alternative you can also use a QR Code:  

The GUIDs for individual cells are displayed in the table below:

Summary of computational transaction
Raw Inputview raw input (R code)
Raw Outputview raw output of R engine
Computing time1 seconds
R Server'Herman Ole Andreas Wold' @ wold.wessa.net


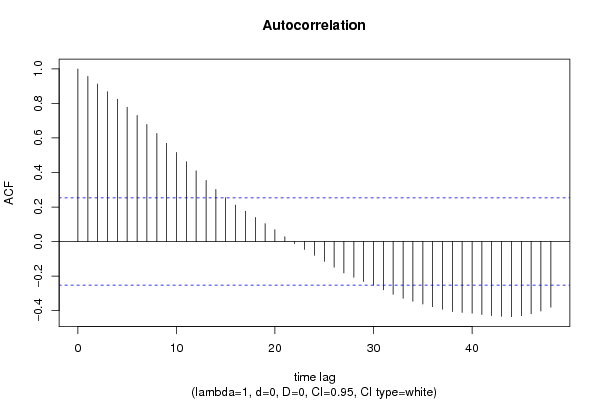
Autocorrelation Function
Time lag kACF(k)T-STATP-value
10.9563997.40820
20.9120137.06440
30.868176.72480
40.8243986.38580
50.7782146.0280
60.7307715.66050
70.6785715.25621e-06
80.6259864.84895e-06
90.5700654.41572.1e-05
100.5164174.00028.8e-05
110.4621243.57960.000345
120.409683.17340.001188
130.3538652.7410.004029
140.3015512.33580.011431
150.2539451.9670.026904
160.2111091.63520.053617
170.1758511.36210.089124
180.1397691.08260.141649
190.1037740.80380.212335
200.0685150.53070.298787
210.028380.21980.413373
22-0.011173-0.08650.46566
23-0.04519-0.350.363766
24-0.079611-0.61670.269893
25-0.114837-0.88950.188638
26-0.148104-1.14720.127925
27-0.181425-1.40530.082543
28-0.206723-1.60130.057285
29-0.230963-1.7890.039329
30-0.253249-1.96170.027223
31-0.27959-2.16570.01716
32-0.304879-2.36160.01073
33-0.328692-2.5460.006741
34-0.345388-2.67540.004804
35-0.362084-2.80470.003389
36-0.376996-2.92020.002461
37-0.391646-3.03370.001784
38-0.405438-3.14050.001309
39-0.410449-3.17930.001168
40-0.414817-3.21320.001057
41-0.422473-3.27250.000885
42-0.428191-3.31680.000775
43-0.432283-3.34840.000704
44-0.435026-3.36970.00066
45-0.429037-3.32330.00076
46-0.418204-3.23940.000977
47-0.402273-3.1160.001406
48-0.379965-2.94320.002307

\begin{tabular}{lllllllll}
\hline
Autocorrelation Function \tabularnewline
Time lag k & ACF(k) & T-STAT & P-value \tabularnewline
1 & 0.956399 & 7.4082 & 0 \tabularnewline
2 & 0.912013 & 7.0644 & 0 \tabularnewline
3 & 0.86817 & 6.7248 & 0 \tabularnewline
4 & 0.824398 & 6.3858 & 0 \tabularnewline
5 & 0.778214 & 6.028 & 0 \tabularnewline
6 & 0.730771 & 5.6605 & 0 \tabularnewline
7 & 0.678571 & 5.2562 & 1e-06 \tabularnewline
8 & 0.625986 & 4.8489 & 5e-06 \tabularnewline
9 & 0.570065 & 4.4157 & 2.1e-05 \tabularnewline
10 & 0.516417 & 4.0002 & 8.8e-05 \tabularnewline
11 & 0.462124 & 3.5796 & 0.000345 \tabularnewline
12 & 0.40968 & 3.1734 & 0.001188 \tabularnewline
13 & 0.353865 & 2.741 & 0.004029 \tabularnewline
14 & 0.301551 & 2.3358 & 0.011431 \tabularnewline
15 & 0.253945 & 1.967 & 0.026904 \tabularnewline
16 & 0.211109 & 1.6352 & 0.053617 \tabularnewline
17 & 0.175851 & 1.3621 & 0.089124 \tabularnewline
18 & 0.139769 & 1.0826 & 0.141649 \tabularnewline
19 & 0.103774 & 0.8038 & 0.212335 \tabularnewline
20 & 0.068515 & 0.5307 & 0.298787 \tabularnewline
21 & 0.02838 & 0.2198 & 0.413373 \tabularnewline
22 & -0.011173 & -0.0865 & 0.46566 \tabularnewline
23 & -0.04519 & -0.35 & 0.363766 \tabularnewline
24 & -0.079611 & -0.6167 & 0.269893 \tabularnewline
25 & -0.114837 & -0.8895 & 0.188638 \tabularnewline
26 & -0.148104 & -1.1472 & 0.127925 \tabularnewline
27 & -0.181425 & -1.4053 & 0.082543 \tabularnewline
28 & -0.206723 & -1.6013 & 0.057285 \tabularnewline
29 & -0.230963 & -1.789 & 0.039329 \tabularnewline
30 & -0.253249 & -1.9617 & 0.027223 \tabularnewline
31 & -0.27959 & -2.1657 & 0.01716 \tabularnewline
32 & -0.304879 & -2.3616 & 0.01073 \tabularnewline
33 & -0.328692 & -2.546 & 0.006741 \tabularnewline
34 & -0.345388 & -2.6754 & 0.004804 \tabularnewline
35 & -0.362084 & -2.8047 & 0.003389 \tabularnewline
36 & -0.376996 & -2.9202 & 0.002461 \tabularnewline
37 & -0.391646 & -3.0337 & 0.001784 \tabularnewline
38 & -0.405438 & -3.1405 & 0.001309 \tabularnewline
39 & -0.410449 & -3.1793 & 0.001168 \tabularnewline
40 & -0.414817 & -3.2132 & 0.001057 \tabularnewline
41 & -0.422473 & -3.2725 & 0.000885 \tabularnewline
42 & -0.428191 & -3.3168 & 0.000775 \tabularnewline
43 & -0.432283 & -3.3484 & 0.000704 \tabularnewline
44 & -0.435026 & -3.3697 & 0.00066 \tabularnewline
45 & -0.429037 & -3.3233 & 0.00076 \tabularnewline
46 & -0.418204 & -3.2394 & 0.000977 \tabularnewline
47 & -0.402273 & -3.116 & 0.001406 \tabularnewline
48 & -0.379965 & -2.9432 & 0.002307 \tabularnewline
\hline
\end{tabular}
%Source: https://freestatistics.org/blog/index.php?pk=144206&T=1

[TABLE]
[ROW][C]Autocorrelation Function[/C][/ROW]
[ROW][C]Time lag k[/C][C]ACF(k)[/C][C]T-STAT[/C][C]P-value[/C][/ROW]
[ROW][C]1[/C][C]0.956399[/C][C]7.4082[/C][C]0[/C][/ROW]
[ROW][C]2[/C][C]0.912013[/C][C]7.0644[/C][C]0[/C][/ROW]
[ROW][C]3[/C][C]0.86817[/C][C]6.7248[/C][C]0[/C][/ROW]
[ROW][C]4[/C][C]0.824398[/C][C]6.3858[/C][C]0[/C][/ROW]
[ROW][C]5[/C][C]0.778214[/C][C]6.028[/C][C]0[/C][/ROW]
[ROW][C]6[/C][C]0.730771[/C][C]5.6605[/C][C]0[/C][/ROW]
[ROW][C]7[/C][C]0.678571[/C][C]5.2562[/C][C]1e-06[/C][/ROW]
[ROW][C]8[/C][C]0.625986[/C][C]4.8489[/C][C]5e-06[/C][/ROW]
[ROW][C]9[/C][C]0.570065[/C][C]4.4157[/C][C]2.1e-05[/C][/ROW]
[ROW][C]10[/C][C]0.516417[/C][C]4.0002[/C][C]8.8e-05[/C][/ROW]
[ROW][C]11[/C][C]0.462124[/C][C]3.5796[/C][C]0.000345[/C][/ROW]
[ROW][C]12[/C][C]0.40968[/C][C]3.1734[/C][C]0.001188[/C][/ROW]
[ROW][C]13[/C][C]0.353865[/C][C]2.741[/C][C]0.004029[/C][/ROW]
[ROW][C]14[/C][C]0.301551[/C][C]2.3358[/C][C]0.011431[/C][/ROW]
[ROW][C]15[/C][C]0.253945[/C][C]1.967[/C][C]0.026904[/C][/ROW]
[ROW][C]16[/C][C]0.211109[/C][C]1.6352[/C][C]0.053617[/C][/ROW]
[ROW][C]17[/C][C]0.175851[/C][C]1.3621[/C][C]0.089124[/C][/ROW]
[ROW][C]18[/C][C]0.139769[/C][C]1.0826[/C][C]0.141649[/C][/ROW]
[ROW][C]19[/C][C]0.103774[/C][C]0.8038[/C][C]0.212335[/C][/ROW]
[ROW][C]20[/C][C]0.068515[/C][C]0.5307[/C][C]0.298787[/C][/ROW]
[ROW][C]21[/C][C]0.02838[/C][C]0.2198[/C][C]0.413373[/C][/ROW]
[ROW][C]22[/C][C]-0.011173[/C][C]-0.0865[/C][C]0.46566[/C][/ROW]
[ROW][C]23[/C][C]-0.04519[/C][C]-0.35[/C][C]0.363766[/C][/ROW]
[ROW][C]24[/C][C]-0.079611[/C][C]-0.6167[/C][C]0.269893[/C][/ROW]
[ROW][C]25[/C][C]-0.114837[/C][C]-0.8895[/C][C]0.188638[/C][/ROW]
[ROW][C]26[/C][C]-0.148104[/C][C]-1.1472[/C][C]0.127925[/C][/ROW]
[ROW][C]27[/C][C]-0.181425[/C][C]-1.4053[/C][C]0.082543[/C][/ROW]
[ROW][C]28[/C][C]-0.206723[/C][C]-1.6013[/C][C]0.057285[/C][/ROW]
[ROW][C]29[/C][C]-0.230963[/C][C]-1.789[/C][C]0.039329[/C][/ROW]
[ROW][C]30[/C][C]-0.253249[/C][C]-1.9617[/C][C]0.027223[/C][/ROW]
[ROW][C]31[/C][C]-0.27959[/C][C]-2.1657[/C][C]0.01716[/C][/ROW]
[ROW][C]32[/C][C]-0.304879[/C][C]-2.3616[/C][C]0.01073[/C][/ROW]
[ROW][C]33[/C][C]-0.328692[/C][C]-2.546[/C][C]0.006741[/C][/ROW]
[ROW][C]34[/C][C]-0.345388[/C][C]-2.6754[/C][C]0.004804[/C][/ROW]
[ROW][C]35[/C][C]-0.362084[/C][C]-2.8047[/C][C]0.003389[/C][/ROW]
[ROW][C]36[/C][C]-0.376996[/C][C]-2.9202[/C][C]0.002461[/C][/ROW]
[ROW][C]37[/C][C]-0.391646[/C][C]-3.0337[/C][C]0.001784[/C][/ROW]
[ROW][C]38[/C][C]-0.405438[/C][C]-3.1405[/C][C]0.001309[/C][/ROW]
[ROW][C]39[/C][C]-0.410449[/C][C]-3.1793[/C][C]0.001168[/C][/ROW]
[ROW][C]40[/C][C]-0.414817[/C][C]-3.2132[/C][C]0.001057[/C][/ROW]
[ROW][C]41[/C][C]-0.422473[/C][C]-3.2725[/C][C]0.000885[/C][/ROW]
[ROW][C]42[/C][C]-0.428191[/C][C]-3.3168[/C][C]0.000775[/C][/ROW]
[ROW][C]43[/C][C]-0.432283[/C][C]-3.3484[/C][C]0.000704[/C][/ROW]
[ROW][C]44[/C][C]-0.435026[/C][C]-3.3697[/C][C]0.00066[/C][/ROW]
[ROW][C]45[/C][C]-0.429037[/C][C]-3.3233[/C][C]0.00076[/C][/ROW]
[ROW][C]46[/C][C]-0.418204[/C][C]-3.2394[/C][C]0.000977[/C][/ROW]
[ROW][C]47[/C][C]-0.402273[/C][C]-3.116[/C][C]0.001406[/C][/ROW]
[ROW][C]48[/C][C]-0.379965[/C][C]-2.9432[/C][C]0.002307[/C][/ROW]
[/TABLE]
Source: https://freestatistics.org/blog/index.php?pk=144206&T=1

Globally Unique Identifier (entire table): ba.freestatistics.org/blog/index.php?pk=144206&T=1

As an alternative you can also use a QR Code:  

The GUIDs for individual cells are displayed in the table below:

Autocorrelation Function
Time lag kACF(k)T-STATP-value
10.9563997.40820
20.9120137.06440
30.868176.72480
40.8243986.38580
50.7782146.0280
60.7307715.66050
70.6785715.25621e-06
80.6259864.84895e-06
90.5700654.41572.1e-05
100.5164174.00028.8e-05
110.4621243.57960.000345
120.409683.17340.001188
130.3538652.7410.004029
140.3015512.33580.011431
150.2539451.9670.026904
160.2111091.63520.053617
170.1758511.36210.089124
180.1397691.08260.141649
190.1037740.80380.212335
200.0685150.53070.298787
210.028380.21980.413373
22-0.011173-0.08650.46566
23-0.04519-0.350.363766
24-0.079611-0.61670.269893
25-0.114837-0.88950.188638
26-0.148104-1.14720.127925
27-0.181425-1.40530.082543
28-0.206723-1.60130.057285
29-0.230963-1.7890.039329
30-0.253249-1.96170.027223
31-0.27959-2.16570.01716
32-0.304879-2.36160.01073
33-0.328692-2.5460.006741
34-0.345388-2.67540.004804
35-0.362084-2.80470.003389
36-0.376996-2.92020.002461
37-0.391646-3.03370.001784
38-0.405438-3.14050.001309
39-0.410449-3.17930.001168
40-0.414817-3.21320.001057
41-0.422473-3.27250.000885
42-0.428191-3.31680.000775
43-0.432283-3.34840.000704
44-0.435026-3.36970.00066
45-0.429037-3.32330.00076
46-0.418204-3.23940.000977
47-0.402273-3.1160.001406
48-0.379965-2.94320.002307


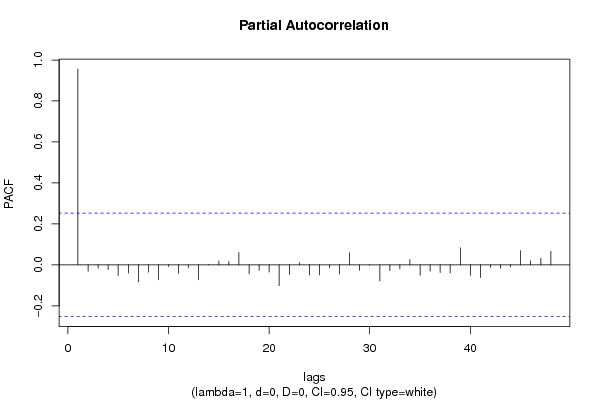
Partial Autocorrelation Function
Time lag kPACF(k)T-STATP-value
10.9563997.40820
2-0.031478-0.24380.404099
3-0.016776-0.12990.448522
4-0.02275-0.17620.430358
5-0.05229-0.4050.343447
6-0.040317-0.31230.377951
7-0.083697-0.64830.259628
8-0.0355-0.2750.392138
9-0.072551-0.5620.288113
10-0.008425-0.06530.474092
11-0.041669-0.32280.373996
12-0.013395-0.10380.458855
13-0.072993-0.56540.286954
140.0015120.01170.495349
150.0189120.14650.442012
160.0164330.12730.449568
170.0603360.46740.320969
18-0.044872-0.34760.364687
19-0.026935-0.20860.417719
20-0.034961-0.27080.393733
21-0.101727-0.7880.216907
22-0.047009-0.36410.358522
230.0115390.08940.464537
24-0.049006-0.37960.352791
25-0.04928-0.38170.352009
26-0.014462-0.1120.455591
27-0.044309-0.34320.366317
280.0586230.45410.325702
29-0.026165-0.20270.420038
30-0.00141-0.01090.49566
31-0.078207-0.60580.27347
32-0.028433-0.22020.413215
33-0.019858-0.15380.439135
340.0252670.19570.422748
35-0.050289-0.38950.34913
36-0.030654-0.23740.406559
37-0.037131-0.28760.387316
38-0.039485-0.30590.380388
390.0827190.64070.262066
40-0.050673-0.39250.348037
41-0.062223-0.4820.315788
42-0.013045-0.1010.459925
43-0.016468-0.12760.449461
44-0.009992-0.07740.469281
450.0693330.53710.29661
460.0195360.15130.440114
470.0325070.25180.40103
480.0661550.51240.305113

\begin{tabular}{lllllllll}
\hline
Partial Autocorrelation Function \tabularnewline
Time lag k & PACF(k) & T-STAT & P-value \tabularnewline
1 & 0.956399 & 7.4082 & 0 \tabularnewline
2 & -0.031478 & -0.2438 & 0.404099 \tabularnewline
3 & -0.016776 & -0.1299 & 0.448522 \tabularnewline
4 & -0.02275 & -0.1762 & 0.430358 \tabularnewline
5 & -0.05229 & -0.405 & 0.343447 \tabularnewline
6 & -0.040317 & -0.3123 & 0.377951 \tabularnewline
7 & -0.083697 & -0.6483 & 0.259628 \tabularnewline
8 & -0.0355 & -0.275 & 0.392138 \tabularnewline
9 & -0.072551 & -0.562 & 0.288113 \tabularnewline
10 & -0.008425 & -0.0653 & 0.474092 \tabularnewline
11 & -0.041669 & -0.3228 & 0.373996 \tabularnewline
12 & -0.013395 & -0.1038 & 0.458855 \tabularnewline
13 & -0.072993 & -0.5654 & 0.286954 \tabularnewline
14 & 0.001512 & 0.0117 & 0.495349 \tabularnewline
15 & 0.018912 & 0.1465 & 0.442012 \tabularnewline
16 & 0.016433 & 0.1273 & 0.449568 \tabularnewline
17 & 0.060336 & 0.4674 & 0.320969 \tabularnewline
18 & -0.044872 & -0.3476 & 0.364687 \tabularnewline
19 & -0.026935 & -0.2086 & 0.417719 \tabularnewline
20 & -0.034961 & -0.2708 & 0.393733 \tabularnewline
21 & -0.101727 & -0.788 & 0.216907 \tabularnewline
22 & -0.047009 & -0.3641 & 0.358522 \tabularnewline
23 & 0.011539 & 0.0894 & 0.464537 \tabularnewline
24 & -0.049006 & -0.3796 & 0.352791 \tabularnewline
25 & -0.04928 & -0.3817 & 0.352009 \tabularnewline
26 & -0.014462 & -0.112 & 0.455591 \tabularnewline
27 & -0.044309 & -0.3432 & 0.366317 \tabularnewline
28 & 0.058623 & 0.4541 & 0.325702 \tabularnewline
29 & -0.026165 & -0.2027 & 0.420038 \tabularnewline
30 & -0.00141 & -0.0109 & 0.49566 \tabularnewline
31 & -0.078207 & -0.6058 & 0.27347 \tabularnewline
32 & -0.028433 & -0.2202 & 0.413215 \tabularnewline
33 & -0.019858 & -0.1538 & 0.439135 \tabularnewline
34 & 0.025267 & 0.1957 & 0.422748 \tabularnewline
35 & -0.050289 & -0.3895 & 0.34913 \tabularnewline
36 & -0.030654 & -0.2374 & 0.406559 \tabularnewline
37 & -0.037131 & -0.2876 & 0.387316 \tabularnewline
38 & -0.039485 & -0.3059 & 0.380388 \tabularnewline
39 & 0.082719 & 0.6407 & 0.262066 \tabularnewline
40 & -0.050673 & -0.3925 & 0.348037 \tabularnewline
41 & -0.062223 & -0.482 & 0.315788 \tabularnewline
42 & -0.013045 & -0.101 & 0.459925 \tabularnewline
43 & -0.016468 & -0.1276 & 0.449461 \tabularnewline
44 & -0.009992 & -0.0774 & 0.469281 \tabularnewline
45 & 0.069333 & 0.5371 & 0.29661 \tabularnewline
46 & 0.019536 & 0.1513 & 0.440114 \tabularnewline
47 & 0.032507 & 0.2518 & 0.40103 \tabularnewline
48 & 0.066155 & 0.5124 & 0.305113 \tabularnewline
\hline
\end{tabular}
%Source: https://freestatistics.org/blog/index.php?pk=144206&T=2

[TABLE]
[ROW][C]Partial Autocorrelation Function[/C][/ROW]
[ROW][C]Time lag k[/C][C]PACF(k)[/C][C]T-STAT[/C][C]P-value[/C][/ROW]
[ROW][C]1[/C][C]0.956399[/C][C]7.4082[/C][C]0[/C][/ROW]
[ROW][C]2[/C][C]-0.031478[/C][C]-0.2438[/C][C]0.404099[/C][/ROW]
[ROW][C]3[/C][C]-0.016776[/C][C]-0.1299[/C][C]0.448522[/C][/ROW]
[ROW][C]4[/C][C]-0.02275[/C][C]-0.1762[/C][C]0.430358[/C][/ROW]
[ROW][C]5[/C][C]-0.05229[/C][C]-0.405[/C][C]0.343447[/C][/ROW]
[ROW][C]6[/C][C]-0.040317[/C][C]-0.3123[/C][C]0.377951[/C][/ROW]
[ROW][C]7[/C][C]-0.083697[/C][C]-0.6483[/C][C]0.259628[/C][/ROW]
[ROW][C]8[/C][C]-0.0355[/C][C]-0.275[/C][C]0.392138[/C][/ROW]
[ROW][C]9[/C][C]-0.072551[/C][C]-0.562[/C][C]0.288113[/C][/ROW]
[ROW][C]10[/C][C]-0.008425[/C][C]-0.0653[/C][C]0.474092[/C][/ROW]
[ROW][C]11[/C][C]-0.041669[/C][C]-0.3228[/C][C]0.373996[/C][/ROW]
[ROW][C]12[/C][C]-0.013395[/C][C]-0.1038[/C][C]0.458855[/C][/ROW]
[ROW][C]13[/C][C]-0.072993[/C][C]-0.5654[/C][C]0.286954[/C][/ROW]
[ROW][C]14[/C][C]0.001512[/C][C]0.0117[/C][C]0.495349[/C][/ROW]
[ROW][C]15[/C][C]0.018912[/C][C]0.1465[/C][C]0.442012[/C][/ROW]
[ROW][C]16[/C][C]0.016433[/C][C]0.1273[/C][C]0.449568[/C][/ROW]
[ROW][C]17[/C][C]0.060336[/C][C]0.4674[/C][C]0.320969[/C][/ROW]
[ROW][C]18[/C][C]-0.044872[/C][C]-0.3476[/C][C]0.364687[/C][/ROW]
[ROW][C]19[/C][C]-0.026935[/C][C]-0.2086[/C][C]0.417719[/C][/ROW]
[ROW][C]20[/C][C]-0.034961[/C][C]-0.2708[/C][C]0.393733[/C][/ROW]
[ROW][C]21[/C][C]-0.101727[/C][C]-0.788[/C][C]0.216907[/C][/ROW]
[ROW][C]22[/C][C]-0.047009[/C][C]-0.3641[/C][C]0.358522[/C][/ROW]
[ROW][C]23[/C][C]0.011539[/C][C]0.0894[/C][C]0.464537[/C][/ROW]
[ROW][C]24[/C][C]-0.049006[/C][C]-0.3796[/C][C]0.352791[/C][/ROW]
[ROW][C]25[/C][C]-0.04928[/C][C]-0.3817[/C][C]0.352009[/C][/ROW]
[ROW][C]26[/C][C]-0.014462[/C][C]-0.112[/C][C]0.455591[/C][/ROW]
[ROW][C]27[/C][C]-0.044309[/C][C]-0.3432[/C][C]0.366317[/C][/ROW]
[ROW][C]28[/C][C]0.058623[/C][C]0.4541[/C][C]0.325702[/C][/ROW]
[ROW][C]29[/C][C]-0.026165[/C][C]-0.2027[/C][C]0.420038[/C][/ROW]
[ROW][C]30[/C][C]-0.00141[/C][C]-0.0109[/C][C]0.49566[/C][/ROW]
[ROW][C]31[/C][C]-0.078207[/C][C]-0.6058[/C][C]0.27347[/C][/ROW]
[ROW][C]32[/C][C]-0.028433[/C][C]-0.2202[/C][C]0.413215[/C][/ROW]
[ROW][C]33[/C][C]-0.019858[/C][C]-0.1538[/C][C]0.439135[/C][/ROW]
[ROW][C]34[/C][C]0.025267[/C][C]0.1957[/C][C]0.422748[/C][/ROW]
[ROW][C]35[/C][C]-0.050289[/C][C]-0.3895[/C][C]0.34913[/C][/ROW]
[ROW][C]36[/C][C]-0.030654[/C][C]-0.2374[/C][C]0.406559[/C][/ROW]
[ROW][C]37[/C][C]-0.037131[/C][C]-0.2876[/C][C]0.387316[/C][/ROW]
[ROW][C]38[/C][C]-0.039485[/C][C]-0.3059[/C][C]0.380388[/C][/ROW]
[ROW][C]39[/C][C]0.082719[/C][C]0.6407[/C][C]0.262066[/C][/ROW]
[ROW][C]40[/C][C]-0.050673[/C][C]-0.3925[/C][C]0.348037[/C][/ROW]
[ROW][C]41[/C][C]-0.062223[/C][C]-0.482[/C][C]0.315788[/C][/ROW]
[ROW][C]42[/C][C]-0.013045[/C][C]-0.101[/C][C]0.459925[/C][/ROW]
[ROW][C]43[/C][C]-0.016468[/C][C]-0.1276[/C][C]0.449461[/C][/ROW]
[ROW][C]44[/C][C]-0.009992[/C][C]-0.0774[/C][C]0.469281[/C][/ROW]
[ROW][C]45[/C][C]0.069333[/C][C]0.5371[/C][C]0.29661[/C][/ROW]
[ROW][C]46[/C][C]0.019536[/C][C]0.1513[/C][C]0.440114[/C][/ROW]
[ROW][C]47[/C][C]0.032507[/C][C]0.2518[/C][C]0.40103[/C][/ROW]
[ROW][C]48[/C][C]0.066155[/C][C]0.5124[/C][C]0.305113[/C][/ROW]
[/TABLE]
Source: https://freestatistics.org/blog/index.php?pk=144206&T=2

Globally Unique Identifier (entire table): ba.freestatistics.org/blog/index.php?pk=144206&T=2

As an alternative you can also use a QR Code:  

The GUIDs for individual cells are displayed in the table below:

Partial Autocorrelation Function
Time lag kPACF(k)T-STATP-value
10.9563997.40820
2-0.031478-0.24380.404099
3-0.016776-0.12990.448522
4-0.02275-0.17620.430358
5-0.05229-0.4050.343447
6-0.040317-0.31230.377951
7-0.083697-0.64830.259628
8-0.0355-0.2750.392138
9-0.072551-0.5620.288113
10-0.008425-0.06530.474092
11-0.041669-0.32280.373996
12-0.013395-0.10380.458855
13-0.072993-0.56540.286954
140.0015120.01170.495349
150.0189120.14650.442012
160.0164330.12730.449568
170.0603360.46740.320969
18-0.044872-0.34760.364687
19-0.026935-0.20860.417719
20-0.034961-0.27080.393733
21-0.101727-0.7880.216907
22-0.047009-0.36410.358522
230.0115390.08940.464537
24-0.049006-0.37960.352791
25-0.04928-0.38170.352009
26-0.014462-0.1120.455591
27-0.044309-0.34320.366317
280.0586230.45410.325702
29-0.026165-0.20270.420038
30-0.00141-0.01090.49566
31-0.078207-0.60580.27347
32-0.028433-0.22020.413215
33-0.019858-0.15380.439135
340.0252670.19570.422748
35-0.050289-0.38950.34913
36-0.030654-0.23740.406559
37-0.037131-0.28760.387316
38-0.039485-0.30590.380388
390.0827190.64070.262066
40-0.050673-0.39250.348037
41-0.062223-0.4820.315788
42-0.013045-0.1010.459925
43-0.016468-0.12760.449461
44-0.009992-0.07740.469281
450.0693330.53710.29661
460.0195360.15130.440114
470.0325070.25180.40103
480.0661550.51240.305113


Parameters (Session):
par1 = 48 ; par2 = 1 ; par3 = 0 ; par4 = 0 ; par5 = 12 ; par6 = White Noise ; par7 = 0.95 ;
Parameters (R input):
par1 = 48 ; par2 = 1 ; par3 = 0 ; par4 = 0 ; par5 = 12 ; par6 = White Noise ; par7 = 0.95 ; par8 = ;
R code (references can be found in the software module):
if (par1 == 'Default') {
par1 = 10*log10(length(x))
} else {
par1 <- as.numeric(par1)
}
par2 <- as.numeric(par2)
par3 <- as.numeric(par3)
par4 <- as.numeric(par4)
par5 <- as.numeric(par5)
if (par6 == 'White Noise') par6 <- 'white' else par6 <- 'ma'
par7 <- as.numeric(par7)
if (par8 != '') par8 <- as.numeric(par8)
ox <- x
if (par8 == '') {
if (par2 == 0) {
x <- log(x)
} else {
x <- (x ^ par2 - 1) / par2
}
} else {
x <- log(x,base=par8)
}
if (par3 > 0) x <- diff(x,lag=1,difference=par3)
if (par4 > 0) x <- diff(x,lag=par5,difference=par4)
bitmap(file='picts.png')
op <- par(mfrow=c(2,1))
plot(ox,type='l',main='Original Time Series',xlab='time',ylab='value')
if (par8=='') {
mytitle <- paste('Working Time Series (lambda=',par2,', d=',par3,', D=',par4,')',sep='')
mysub <- paste('(lambda=',par2,', d=',par3,', D=',par4,', CI=', par7, ', CI type=',par6,')',sep='')
} else {
mytitle <- paste('Working Time Series (base=',par8,', d=',par3,', D=',par4,')',sep='')
mysub <- paste('(base=',par8,', d=',par3,', D=',par4,', CI=', par7, ', CI type=',par6,')',sep='')
}
plot(x,type='l', main=mytitle,xlab='time',ylab='value')
par(op)
dev.off()
bitmap(file='pic1.png')
racf <- acf(x, par1, main='Autocorrelation', xlab='time lag', ylab='ACF', ci.type=par6, ci=par7, sub=mysub)
dev.off()
bitmap(file='pic2.png')
rpacf <- pacf(x,par1,main='Partial Autocorrelation',xlab='lags',ylab='PACF',sub=mysub)
dev.off()
(myacf <- c(racf$acf))
(mypacf <- c(rpacf$acf))
lengthx <- length(x)
sqrtn <- sqrt(lengthx)
load(file='createtable')
a<-table.start()
a<-table.row.start(a)
a<-table.element(a,'Autocorrelation Function',4,TRUE)
a<-table.row.end(a)
a<-table.row.start(a)
a<-table.element(a,'Time lag k',header=TRUE)
a<-table.element(a,hyperlink('basics.htm','ACF(k)','click here for more information about the Autocorrelation Function'),header=TRUE)
a<-table.element(a,'T-STAT',header=TRUE)
a<-table.element(a,'P-value',header=TRUE)
a<-table.row.end(a)
for (i in 2:(par1+1)) {
a<-table.row.start(a)
a<-table.element(a,i-1,header=TRUE)
a<-table.element(a,round(myacf[i],6))
mytstat <- myacf[i]*sqrtn
a<-table.element(a,round(mytstat,4))
a<-table.element(a,round(1-pt(abs(mytstat),lengthx),6))
a<-table.row.end(a)
}
a<-table.end(a)
table.save(a,file='mytable.tab')
a<-table.start()
a<-table.row.start(a)
a<-table.element(a,'Partial Autocorrelation Function',4,TRUE)
a<-table.row.end(a)
a<-table.row.start(a)
a<-table.element(a,'Time lag k',header=TRUE)
a<-table.element(a,hyperlink('basics.htm','PACF(k)','click here for more information about the Partial Autocorrelation Function'),header=TRUE)
a<-table.element(a,'T-STAT',header=TRUE)
a<-table.element(a,'P-value',header=TRUE)
a<-table.row.end(a)
for (i in 1:par1) {
a<-table.row.start(a)
a<-table.element(a,i,header=TRUE)
a<-table.element(a,round(mypacf[i],6))
mytstat <- mypacf[i]*sqrtn
a<-table.element(a,round(mytstat,4))
a<-table.element(a,round(1-pt(abs(mytstat),lengthx),6))
a<-table.row.end(a)
}
a<-table.end(a)
table.save(a,file='mytable1.tab')