| Tabulation of Results | ||
| Happiness x Depression | ||
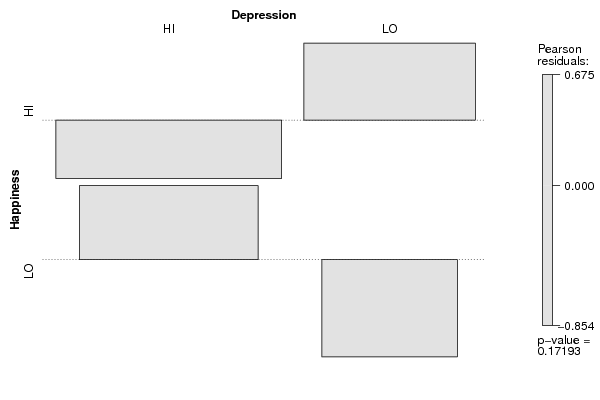
| HI | LO | HI | 18 | 14 | LO | 15 | 5 |
| Tabulation of Expected Results | ||
| Happiness x Depression | ||
| HI | LO | HI | 20.31 | 11.69 | LO | 12.69 | 7.31 |
| Statistical Results | |
| Pearson's Chi-squared test with simulated p-value (based on 2000 replicates) | |
| Exact Pearson Chi Square Statistic | 1.87 |
| P value | 0.22 |