Free Statistics

of Irreproducible Research!

Author's title

Author*Unverified author*
R Software Modulerwasp_autocorrelation.wasp
Title produced by software(Partial) Autocorrelation Function
Date of computationWed, 16 Nov 2011 13:22:54 -0500
Cite this page as followsStatistical Computations at FreeStatistics.org, Office for Research Development and Education, URL https://freestatistics.org/blog/index.php?v=date/2011/Nov/16/t1321467883hahhydz6bv6hqd7.htm/, Retrieved Sat, 20 Apr 2024 12:22:24 +0000
Statistical Computations at FreeStatistics.org, Office for Research Development and Education, URL https://freestatistics.org/blog/index.php?pk=144123, Retrieved Sat, 20 Apr 2024 12:22:24 +0000
QR Codes:

Original text written by user:
IsPrivate?No (this computation is public)
User-defined keywordsKDGP2W12
Estimated Impact75
Family? (F = Feedback message, R = changed R code, M = changed R Module, P = changed Parameters, D = changed Data)
-       [(Partial) Autocorrelation Function] [] [2011-11-16 18:22:54] [c7947c1eb3210bb9ed87c20003884d6d] [Current]
Feedback Forum

Post a new message
Dataseries X:
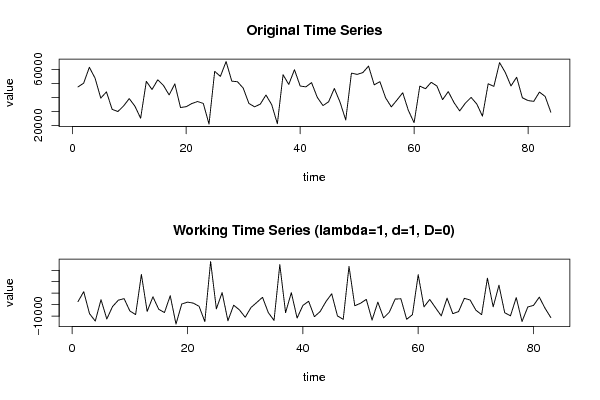
47460
50104
61465
53726
39477
43895
31481
29896
33842
39120
33702
25094
51442
45594
52518
48564
41745
49585
32747
33379
35645
37034
35681
20972
58552
54955
65540
51570
51145
46641
35704
33253
35193
41668
34865
21210
56126
49231
59723
48103
47472
50497
40059
34149
36860
46356
36577
23872
57276
56389
57657
62300
48929
51168
39636
33213
38127
43291
30600
21956
48033
46148
50736
48114
38390
44112
36287
30333
35908
40005
35263
26591
49709
47840
64781
57802
48154
54353
39737
37732
37163
43782
40649
29412


Summary of computational transaction
Raw Inputview raw input (R code)
Raw Outputview raw output of R engine
Computing time2 seconds
R Server'George Udny Yule' @ yule.wessa.net

\begin{tabular}{lllllllll}
\hline
Summary of computational transaction \tabularnewline
Raw Input & view raw input (R code)  \tabularnewline
Raw Output & view raw output of R engine  \tabularnewline
Computing time & 2 seconds \tabularnewline
R Server & 'George Udny Yule' @ yule.wessa.net \tabularnewline
\hline
\end{tabular}
%Source: https://freestatistics.org/blog/index.php?pk=144123&T=0

[TABLE]
[ROW][C]Summary of computational transaction[/C][/ROW]
[ROW][C]Raw Input[/C][C]view raw input (R code) [/C][/ROW]
[ROW][C]Raw Output[/C][C]view raw output of R engine [/C][/ROW]
[ROW][C]Computing time[/C][C]2 seconds[/C][/ROW]
[ROW][C]R Server[/C][C]'George Udny Yule' @ yule.wessa.net[/C][/ROW]
[/TABLE]
Source: https://freestatistics.org/blog/index.php?pk=144123&T=0

Globally Unique Identifier (entire table): ba.freestatistics.org/blog/index.php?pk=144123&T=0

As an alternative you can also use a QR Code:  

The GUIDs for individual cells are displayed in the table below:

Summary of computational transaction
Raw Inputview raw input (R code)
Raw Outputview raw output of R engine
Computing time2 seconds
R Server'George Udny Yule' @ yule.wessa.net


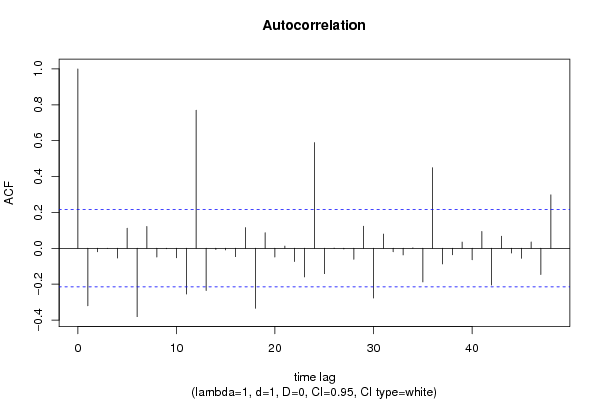
Autocorrelation Function
Time lag kACF(k)T-STATP-value
1-0.31987-2.91420.002291
2-0.018886-0.17210.431905
3-0.000229-0.00210.499169
4-0.053668-0.48890.313088
50.1114281.01520.156491
6-0.381056-3.47160.000412
70.1219081.11060.134966
8-0.048205-0.43920.330842
9-0.002272-0.02070.491769
10-0.053172-0.48440.314682
11-0.254593-2.31950.011414
120.7700177.01520
13-0.235393-2.14450.017457
14-0.006435-0.05860.476696
15-0.008968-0.08170.467539
16-0.046326-0.42210.337039
170.1153411.05080.148199
18-0.333861-3.04160.001575
190.0870790.79330.214926
20-0.048856-0.44510.328705
210.0121040.11030.456229
22-0.073248-0.66730.25321
23-0.159461-1.45280.07503
240.5893295.3690
25-0.141136-1.28580.101043
26-0.000896-0.00820.496754
27-0.00372-0.03390.486523
28-0.060673-0.55280.290958
290.1226651.11750.133497
30-0.276922-2.52290.006774
310.0792720.72220.236101
32-0.018944-0.17260.431698
33-0.03685-0.33570.368964
340.0008020.00730.497095
35-0.187181-1.70530.04594
360.4488354.08915e-05
37-0.086852-0.79130.215523
38-0.036285-0.33060.3709
390.0345030.31430.377027
40-0.063471-0.57820.282333
410.0936210.85290.198078
42-0.204746-1.86530.032835
430.0672080.61230.27101
44-0.026366-0.24020.405382
45-0.055713-0.50760.306549
460.0352080.32080.374599
47-0.146186-1.33180.093283
480.2980462.71530.004027

\begin{tabular}{lllllllll}
\hline
Autocorrelation Function \tabularnewline
Time lag k & ACF(k) & T-STAT & P-value \tabularnewline
1 & -0.31987 & -2.9142 & 0.002291 \tabularnewline
2 & -0.018886 & -0.1721 & 0.431905 \tabularnewline
3 & -0.000229 & -0.0021 & 0.499169 \tabularnewline
4 & -0.053668 & -0.4889 & 0.313088 \tabularnewline
5 & 0.111428 & 1.0152 & 0.156491 \tabularnewline
6 & -0.381056 & -3.4716 & 0.000412 \tabularnewline
7 & 0.121908 & 1.1106 & 0.134966 \tabularnewline
8 & -0.048205 & -0.4392 & 0.330842 \tabularnewline
9 & -0.002272 & -0.0207 & 0.491769 \tabularnewline
10 & -0.053172 & -0.4844 & 0.314682 \tabularnewline
11 & -0.254593 & -2.3195 & 0.011414 \tabularnewline
12 & 0.770017 & 7.0152 & 0 \tabularnewline
13 & -0.235393 & -2.1445 & 0.017457 \tabularnewline
14 & -0.006435 & -0.0586 & 0.476696 \tabularnewline
15 & -0.008968 & -0.0817 & 0.467539 \tabularnewline
16 & -0.046326 & -0.4221 & 0.337039 \tabularnewline
17 & 0.115341 & 1.0508 & 0.148199 \tabularnewline
18 & -0.333861 & -3.0416 & 0.001575 \tabularnewline
19 & 0.087079 & 0.7933 & 0.214926 \tabularnewline
20 & -0.048856 & -0.4451 & 0.328705 \tabularnewline
21 & 0.012104 & 0.1103 & 0.456229 \tabularnewline
22 & -0.073248 & -0.6673 & 0.25321 \tabularnewline
23 & -0.159461 & -1.4528 & 0.07503 \tabularnewline
24 & 0.589329 & 5.369 & 0 \tabularnewline
25 & -0.141136 & -1.2858 & 0.101043 \tabularnewline
26 & -0.000896 & -0.0082 & 0.496754 \tabularnewline
27 & -0.00372 & -0.0339 & 0.486523 \tabularnewline
28 & -0.060673 & -0.5528 & 0.290958 \tabularnewline
29 & 0.122665 & 1.1175 & 0.133497 \tabularnewline
30 & -0.276922 & -2.5229 & 0.006774 \tabularnewline
31 & 0.079272 & 0.7222 & 0.236101 \tabularnewline
32 & -0.018944 & -0.1726 & 0.431698 \tabularnewline
33 & -0.03685 & -0.3357 & 0.368964 \tabularnewline
34 & 0.000802 & 0.0073 & 0.497095 \tabularnewline
35 & -0.187181 & -1.7053 & 0.04594 \tabularnewline
36 & 0.448835 & 4.0891 & 5e-05 \tabularnewline
37 & -0.086852 & -0.7913 & 0.215523 \tabularnewline
38 & -0.036285 & -0.3306 & 0.3709 \tabularnewline
39 & 0.034503 & 0.3143 & 0.377027 \tabularnewline
40 & -0.063471 & -0.5782 & 0.282333 \tabularnewline
41 & 0.093621 & 0.8529 & 0.198078 \tabularnewline
42 & -0.204746 & -1.8653 & 0.032835 \tabularnewline
43 & 0.067208 & 0.6123 & 0.27101 \tabularnewline
44 & -0.026366 & -0.2402 & 0.405382 \tabularnewline
45 & -0.055713 & -0.5076 & 0.306549 \tabularnewline
46 & 0.035208 & 0.3208 & 0.374599 \tabularnewline
47 & -0.146186 & -1.3318 & 0.093283 \tabularnewline
48 & 0.298046 & 2.7153 & 0.004027 \tabularnewline
\hline
\end{tabular}
%Source: https://freestatistics.org/blog/index.php?pk=144123&T=1

[TABLE]
[ROW][C]Autocorrelation Function[/C][/ROW]
[ROW][C]Time lag k[/C][C]ACF(k)[/C][C]T-STAT[/C][C]P-value[/C][/ROW]
[ROW][C]1[/C][C]-0.31987[/C][C]-2.9142[/C][C]0.002291[/C][/ROW]
[ROW][C]2[/C][C]-0.018886[/C][C]-0.1721[/C][C]0.431905[/C][/ROW]
[ROW][C]3[/C][C]-0.000229[/C][C]-0.0021[/C][C]0.499169[/C][/ROW]
[ROW][C]4[/C][C]-0.053668[/C][C]-0.4889[/C][C]0.313088[/C][/ROW]
[ROW][C]5[/C][C]0.111428[/C][C]1.0152[/C][C]0.156491[/C][/ROW]
[ROW][C]6[/C][C]-0.381056[/C][C]-3.4716[/C][C]0.000412[/C][/ROW]
[ROW][C]7[/C][C]0.121908[/C][C]1.1106[/C][C]0.134966[/C][/ROW]
[ROW][C]8[/C][C]-0.048205[/C][C]-0.4392[/C][C]0.330842[/C][/ROW]
[ROW][C]9[/C][C]-0.002272[/C][C]-0.0207[/C][C]0.491769[/C][/ROW]
[ROW][C]10[/C][C]-0.053172[/C][C]-0.4844[/C][C]0.314682[/C][/ROW]
[ROW][C]11[/C][C]-0.254593[/C][C]-2.3195[/C][C]0.011414[/C][/ROW]
[ROW][C]12[/C][C]0.770017[/C][C]7.0152[/C][C]0[/C][/ROW]
[ROW][C]13[/C][C]-0.235393[/C][C]-2.1445[/C][C]0.017457[/C][/ROW]
[ROW][C]14[/C][C]-0.006435[/C][C]-0.0586[/C][C]0.476696[/C][/ROW]
[ROW][C]15[/C][C]-0.008968[/C][C]-0.0817[/C][C]0.467539[/C][/ROW]
[ROW][C]16[/C][C]-0.046326[/C][C]-0.4221[/C][C]0.337039[/C][/ROW]
[ROW][C]17[/C][C]0.115341[/C][C]1.0508[/C][C]0.148199[/C][/ROW]
[ROW][C]18[/C][C]-0.333861[/C][C]-3.0416[/C][C]0.001575[/C][/ROW]
[ROW][C]19[/C][C]0.087079[/C][C]0.7933[/C][C]0.214926[/C][/ROW]
[ROW][C]20[/C][C]-0.048856[/C][C]-0.4451[/C][C]0.328705[/C][/ROW]
[ROW][C]21[/C][C]0.012104[/C][C]0.1103[/C][C]0.456229[/C][/ROW]
[ROW][C]22[/C][C]-0.073248[/C][C]-0.6673[/C][C]0.25321[/C][/ROW]
[ROW][C]23[/C][C]-0.159461[/C][C]-1.4528[/C][C]0.07503[/C][/ROW]
[ROW][C]24[/C][C]0.589329[/C][C]5.369[/C][C]0[/C][/ROW]
[ROW][C]25[/C][C]-0.141136[/C][C]-1.2858[/C][C]0.101043[/C][/ROW]
[ROW][C]26[/C][C]-0.000896[/C][C]-0.0082[/C][C]0.496754[/C][/ROW]
[ROW][C]27[/C][C]-0.00372[/C][C]-0.0339[/C][C]0.486523[/C][/ROW]
[ROW][C]28[/C][C]-0.060673[/C][C]-0.5528[/C][C]0.290958[/C][/ROW]
[ROW][C]29[/C][C]0.122665[/C][C]1.1175[/C][C]0.133497[/C][/ROW]
[ROW][C]30[/C][C]-0.276922[/C][C]-2.5229[/C][C]0.006774[/C][/ROW]
[ROW][C]31[/C][C]0.079272[/C][C]0.7222[/C][C]0.236101[/C][/ROW]
[ROW][C]32[/C][C]-0.018944[/C][C]-0.1726[/C][C]0.431698[/C][/ROW]
[ROW][C]33[/C][C]-0.03685[/C][C]-0.3357[/C][C]0.368964[/C][/ROW]
[ROW][C]34[/C][C]0.000802[/C][C]0.0073[/C][C]0.497095[/C][/ROW]
[ROW][C]35[/C][C]-0.187181[/C][C]-1.7053[/C][C]0.04594[/C][/ROW]
[ROW][C]36[/C][C]0.448835[/C][C]4.0891[/C][C]5e-05[/C][/ROW]
[ROW][C]37[/C][C]-0.086852[/C][C]-0.7913[/C][C]0.215523[/C][/ROW]
[ROW][C]38[/C][C]-0.036285[/C][C]-0.3306[/C][C]0.3709[/C][/ROW]
[ROW][C]39[/C][C]0.034503[/C][C]0.3143[/C][C]0.377027[/C][/ROW]
[ROW][C]40[/C][C]-0.063471[/C][C]-0.5782[/C][C]0.282333[/C][/ROW]
[ROW][C]41[/C][C]0.093621[/C][C]0.8529[/C][C]0.198078[/C][/ROW]
[ROW][C]42[/C][C]-0.204746[/C][C]-1.8653[/C][C]0.032835[/C][/ROW]
[ROW][C]43[/C][C]0.067208[/C][C]0.6123[/C][C]0.27101[/C][/ROW]
[ROW][C]44[/C][C]-0.026366[/C][C]-0.2402[/C][C]0.405382[/C][/ROW]
[ROW][C]45[/C][C]-0.055713[/C][C]-0.5076[/C][C]0.306549[/C][/ROW]
[ROW][C]46[/C][C]0.035208[/C][C]0.3208[/C][C]0.374599[/C][/ROW]
[ROW][C]47[/C][C]-0.146186[/C][C]-1.3318[/C][C]0.093283[/C][/ROW]
[ROW][C]48[/C][C]0.298046[/C][C]2.7153[/C][C]0.004027[/C][/ROW]
[/TABLE]
Source: https://freestatistics.org/blog/index.php?pk=144123&T=1

Globally Unique Identifier (entire table): ba.freestatistics.org/blog/index.php?pk=144123&T=1

As an alternative you can also use a QR Code:  

The GUIDs for individual cells are displayed in the table below:

Autocorrelation Function
Time lag kACF(k)T-STATP-value
1-0.31987-2.91420.002291
2-0.018886-0.17210.431905
3-0.000229-0.00210.499169
4-0.053668-0.48890.313088
50.1114281.01520.156491
6-0.381056-3.47160.000412
70.1219081.11060.134966
8-0.048205-0.43920.330842
9-0.002272-0.02070.491769
10-0.053172-0.48440.314682
11-0.254593-2.31950.011414
120.7700177.01520
13-0.235393-2.14450.017457
14-0.006435-0.05860.476696
15-0.008968-0.08170.467539
16-0.046326-0.42210.337039
170.1153411.05080.148199
18-0.333861-3.04160.001575
190.0870790.79330.214926
20-0.048856-0.44510.328705
210.0121040.11030.456229
22-0.073248-0.66730.25321
23-0.159461-1.45280.07503
240.5893295.3690
25-0.141136-1.28580.101043
26-0.000896-0.00820.496754
27-0.00372-0.03390.486523
28-0.060673-0.55280.290958
290.1226651.11750.133497
30-0.276922-2.52290.006774
310.0792720.72220.236101
32-0.018944-0.17260.431698
33-0.03685-0.33570.368964
340.0008020.00730.497095
35-0.187181-1.70530.04594
360.4488354.08915e-05
37-0.086852-0.79130.215523
38-0.036285-0.33060.3709
390.0345030.31430.377027
40-0.063471-0.57820.282333
410.0936210.85290.198078
42-0.204746-1.86530.032835
430.0672080.61230.27101
44-0.026366-0.24020.405382
45-0.055713-0.50760.306549
460.0352080.32080.374599
47-0.146186-1.33180.093283
480.2980462.71530.004027


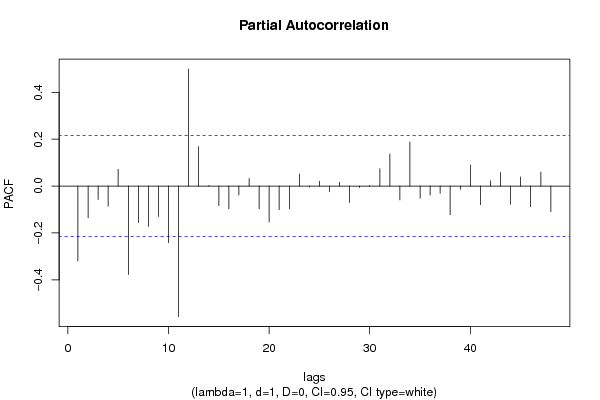
Partial Autocorrelation Function
Time lag kPACF(k)T-STATP-value
1-0.31987-2.91420.002291
2-0.135017-1.23010.111073
3-0.057044-0.51970.302329
4-0.08531-0.77720.219622
50.0714030.65050.25858
6-0.376773-3.43260.000467
7-0.155227-1.41420.080523
8-0.172032-1.56730.060426
9-0.129911-1.18350.119986
10-0.241027-2.19590.015446
11-0.556855-5.07321e-06
120.4997594.5539e-06
130.1685721.53580.0642
140.0022460.02050.491862
15-0.083267-0.75860.225122
16-0.096794-0.88180.190205
17-0.037971-0.34590.365135
180.0322410.29370.384848
19-0.096281-0.87720.191466
20-0.15302-1.39410.083507
21-0.100306-0.91380.181725
22-0.096806-0.88190.190176
230.0511510.4660.321215
24-0.003968-0.03620.485624
250.0208270.18970.424986
26-0.024126-0.21980.413283
270.0167690.15280.439476
28-0.069765-0.63560.263397
29-0.006239-0.05680.477406
300.002730.02490.490107
310.074010.67430.251009
320.1370831.24890.10761
33-0.058684-0.53460.297167
340.187871.71160.045355
35-0.051322-0.46760.320662
36-0.038473-0.35050.363422
37-0.030191-0.27510.391978
38-0.121931-1.11080.134921
39-0.014441-0.13160.447822
400.0903870.82350.206301
41-0.079185-0.72140.236343
420.0230980.21040.416921
430.0581790.530.298751
44-0.077094-0.70240.242211
450.038850.35390.36214
46-0.088428-0.80560.211383
470.0596270.54320.294214
48-0.10893-0.99240.161943

\begin{tabular}{lllllllll}
\hline
Partial Autocorrelation Function \tabularnewline
Time lag k & PACF(k) & T-STAT & P-value \tabularnewline
1 & -0.31987 & -2.9142 & 0.002291 \tabularnewline
2 & -0.135017 & -1.2301 & 0.111073 \tabularnewline
3 & -0.057044 & -0.5197 & 0.302329 \tabularnewline
4 & -0.08531 & -0.7772 & 0.219622 \tabularnewline
5 & 0.071403 & 0.6505 & 0.25858 \tabularnewline
6 & -0.376773 & -3.4326 & 0.000467 \tabularnewline
7 & -0.155227 & -1.4142 & 0.080523 \tabularnewline
8 & -0.172032 & -1.5673 & 0.060426 \tabularnewline
9 & -0.129911 & -1.1835 & 0.119986 \tabularnewline
10 & -0.241027 & -2.1959 & 0.015446 \tabularnewline
11 & -0.556855 & -5.0732 & 1e-06 \tabularnewline
12 & 0.499759 & 4.553 & 9e-06 \tabularnewline
13 & 0.168572 & 1.5358 & 0.0642 \tabularnewline
14 & 0.002246 & 0.0205 & 0.491862 \tabularnewline
15 & -0.083267 & -0.7586 & 0.225122 \tabularnewline
16 & -0.096794 & -0.8818 & 0.190205 \tabularnewline
17 & -0.037971 & -0.3459 & 0.365135 \tabularnewline
18 & 0.032241 & 0.2937 & 0.384848 \tabularnewline
19 & -0.096281 & -0.8772 & 0.191466 \tabularnewline
20 & -0.15302 & -1.3941 & 0.083507 \tabularnewline
21 & -0.100306 & -0.9138 & 0.181725 \tabularnewline
22 & -0.096806 & -0.8819 & 0.190176 \tabularnewline
23 & 0.051151 & 0.466 & 0.321215 \tabularnewline
24 & -0.003968 & -0.0362 & 0.485624 \tabularnewline
25 & 0.020827 & 0.1897 & 0.424986 \tabularnewline
26 & -0.024126 & -0.2198 & 0.413283 \tabularnewline
27 & 0.016769 & 0.1528 & 0.439476 \tabularnewline
28 & -0.069765 & -0.6356 & 0.263397 \tabularnewline
29 & -0.006239 & -0.0568 & 0.477406 \tabularnewline
30 & 0.00273 & 0.0249 & 0.490107 \tabularnewline
31 & 0.07401 & 0.6743 & 0.251009 \tabularnewline
32 & 0.137083 & 1.2489 & 0.10761 \tabularnewline
33 & -0.058684 & -0.5346 & 0.297167 \tabularnewline
34 & 0.18787 & 1.7116 & 0.045355 \tabularnewline
35 & -0.051322 & -0.4676 & 0.320662 \tabularnewline
36 & -0.038473 & -0.3505 & 0.363422 \tabularnewline
37 & -0.030191 & -0.2751 & 0.391978 \tabularnewline
38 & -0.121931 & -1.1108 & 0.134921 \tabularnewline
39 & -0.014441 & -0.1316 & 0.447822 \tabularnewline
40 & 0.090387 & 0.8235 & 0.206301 \tabularnewline
41 & -0.079185 & -0.7214 & 0.236343 \tabularnewline
42 & 0.023098 & 0.2104 & 0.416921 \tabularnewline
43 & 0.058179 & 0.53 & 0.298751 \tabularnewline
44 & -0.077094 & -0.7024 & 0.242211 \tabularnewline
45 & 0.03885 & 0.3539 & 0.36214 \tabularnewline
46 & -0.088428 & -0.8056 & 0.211383 \tabularnewline
47 & 0.059627 & 0.5432 & 0.294214 \tabularnewline
48 & -0.10893 & -0.9924 & 0.161943 \tabularnewline
\hline
\end{tabular}
%Source: https://freestatistics.org/blog/index.php?pk=144123&T=2

[TABLE]
[ROW][C]Partial Autocorrelation Function[/C][/ROW]
[ROW][C]Time lag k[/C][C]PACF(k)[/C][C]T-STAT[/C][C]P-value[/C][/ROW]
[ROW][C]1[/C][C]-0.31987[/C][C]-2.9142[/C][C]0.002291[/C][/ROW]
[ROW][C]2[/C][C]-0.135017[/C][C]-1.2301[/C][C]0.111073[/C][/ROW]
[ROW][C]3[/C][C]-0.057044[/C][C]-0.5197[/C][C]0.302329[/C][/ROW]
[ROW][C]4[/C][C]-0.08531[/C][C]-0.7772[/C][C]0.219622[/C][/ROW]
[ROW][C]5[/C][C]0.071403[/C][C]0.6505[/C][C]0.25858[/C][/ROW]
[ROW][C]6[/C][C]-0.376773[/C][C]-3.4326[/C][C]0.000467[/C][/ROW]
[ROW][C]7[/C][C]-0.155227[/C][C]-1.4142[/C][C]0.080523[/C][/ROW]
[ROW][C]8[/C][C]-0.172032[/C][C]-1.5673[/C][C]0.060426[/C][/ROW]
[ROW][C]9[/C][C]-0.129911[/C][C]-1.1835[/C][C]0.119986[/C][/ROW]
[ROW][C]10[/C][C]-0.241027[/C][C]-2.1959[/C][C]0.015446[/C][/ROW]
[ROW][C]11[/C][C]-0.556855[/C][C]-5.0732[/C][C]1e-06[/C][/ROW]
[ROW][C]12[/C][C]0.499759[/C][C]4.553[/C][C]9e-06[/C][/ROW]
[ROW][C]13[/C][C]0.168572[/C][C]1.5358[/C][C]0.0642[/C][/ROW]
[ROW][C]14[/C][C]0.002246[/C][C]0.0205[/C][C]0.491862[/C][/ROW]
[ROW][C]15[/C][C]-0.083267[/C][C]-0.7586[/C][C]0.225122[/C][/ROW]
[ROW][C]16[/C][C]-0.096794[/C][C]-0.8818[/C][C]0.190205[/C][/ROW]
[ROW][C]17[/C][C]-0.037971[/C][C]-0.3459[/C][C]0.365135[/C][/ROW]
[ROW][C]18[/C][C]0.032241[/C][C]0.2937[/C][C]0.384848[/C][/ROW]
[ROW][C]19[/C][C]-0.096281[/C][C]-0.8772[/C][C]0.191466[/C][/ROW]
[ROW][C]20[/C][C]-0.15302[/C][C]-1.3941[/C][C]0.083507[/C][/ROW]
[ROW][C]21[/C][C]-0.100306[/C][C]-0.9138[/C][C]0.181725[/C][/ROW]
[ROW][C]22[/C][C]-0.096806[/C][C]-0.8819[/C][C]0.190176[/C][/ROW]
[ROW][C]23[/C][C]0.051151[/C][C]0.466[/C][C]0.321215[/C][/ROW]
[ROW][C]24[/C][C]-0.003968[/C][C]-0.0362[/C][C]0.485624[/C][/ROW]
[ROW][C]25[/C][C]0.020827[/C][C]0.1897[/C][C]0.424986[/C][/ROW]
[ROW][C]26[/C][C]-0.024126[/C][C]-0.2198[/C][C]0.413283[/C][/ROW]
[ROW][C]27[/C][C]0.016769[/C][C]0.1528[/C][C]0.439476[/C][/ROW]
[ROW][C]28[/C][C]-0.069765[/C][C]-0.6356[/C][C]0.263397[/C][/ROW]
[ROW][C]29[/C][C]-0.006239[/C][C]-0.0568[/C][C]0.477406[/C][/ROW]
[ROW][C]30[/C][C]0.00273[/C][C]0.0249[/C][C]0.490107[/C][/ROW]
[ROW][C]31[/C][C]0.07401[/C][C]0.6743[/C][C]0.251009[/C][/ROW]
[ROW][C]32[/C][C]0.137083[/C][C]1.2489[/C][C]0.10761[/C][/ROW]
[ROW][C]33[/C][C]-0.058684[/C][C]-0.5346[/C][C]0.297167[/C][/ROW]
[ROW][C]34[/C][C]0.18787[/C][C]1.7116[/C][C]0.045355[/C][/ROW]
[ROW][C]35[/C][C]-0.051322[/C][C]-0.4676[/C][C]0.320662[/C][/ROW]
[ROW][C]36[/C][C]-0.038473[/C][C]-0.3505[/C][C]0.363422[/C][/ROW]
[ROW][C]37[/C][C]-0.030191[/C][C]-0.2751[/C][C]0.391978[/C][/ROW]
[ROW][C]38[/C][C]-0.121931[/C][C]-1.1108[/C][C]0.134921[/C][/ROW]
[ROW][C]39[/C][C]-0.014441[/C][C]-0.1316[/C][C]0.447822[/C][/ROW]
[ROW][C]40[/C][C]0.090387[/C][C]0.8235[/C][C]0.206301[/C][/ROW]
[ROW][C]41[/C][C]-0.079185[/C][C]-0.7214[/C][C]0.236343[/C][/ROW]
[ROW][C]42[/C][C]0.023098[/C][C]0.2104[/C][C]0.416921[/C][/ROW]
[ROW][C]43[/C][C]0.058179[/C][C]0.53[/C][C]0.298751[/C][/ROW]
[ROW][C]44[/C][C]-0.077094[/C][C]-0.7024[/C][C]0.242211[/C][/ROW]
[ROW][C]45[/C][C]0.03885[/C][C]0.3539[/C][C]0.36214[/C][/ROW]
[ROW][C]46[/C][C]-0.088428[/C][C]-0.8056[/C][C]0.211383[/C][/ROW]
[ROW][C]47[/C][C]0.059627[/C][C]0.5432[/C][C]0.294214[/C][/ROW]
[ROW][C]48[/C][C]-0.10893[/C][C]-0.9924[/C][C]0.161943[/C][/ROW]
[/TABLE]
Source: https://freestatistics.org/blog/index.php?pk=144123&T=2

Globally Unique Identifier (entire table): ba.freestatistics.org/blog/index.php?pk=144123&T=2

As an alternative you can also use a QR Code:  

The GUIDs for individual cells are displayed in the table below:

Partial Autocorrelation Function
Time lag kPACF(k)T-STATP-value
1-0.31987-2.91420.002291
2-0.135017-1.23010.111073
3-0.057044-0.51970.302329
4-0.08531-0.77720.219622
50.0714030.65050.25858
6-0.376773-3.43260.000467
7-0.155227-1.41420.080523
8-0.172032-1.56730.060426
9-0.129911-1.18350.119986
10-0.241027-2.19590.015446
11-0.556855-5.07321e-06
120.4997594.5539e-06
130.1685721.53580.0642
140.0022460.02050.491862
15-0.083267-0.75860.225122
16-0.096794-0.88180.190205
17-0.037971-0.34590.365135
180.0322410.29370.384848
19-0.096281-0.87720.191466
20-0.15302-1.39410.083507
21-0.100306-0.91380.181725
22-0.096806-0.88190.190176
230.0511510.4660.321215
24-0.003968-0.03620.485624
250.0208270.18970.424986
26-0.024126-0.21980.413283
270.0167690.15280.439476
28-0.069765-0.63560.263397
29-0.006239-0.05680.477406
300.002730.02490.490107
310.074010.67430.251009
320.1370831.24890.10761
33-0.058684-0.53460.297167
340.187871.71160.045355
35-0.051322-0.46760.320662
36-0.038473-0.35050.363422
37-0.030191-0.27510.391978
38-0.121931-1.11080.134921
39-0.014441-0.13160.447822
400.0903870.82350.206301
41-0.079185-0.72140.236343
420.0230980.21040.416921
430.0581790.530.298751
44-0.077094-0.70240.242211
450.038850.35390.36214
46-0.088428-0.80560.211383
470.0596270.54320.294214
48-0.10893-0.99240.161943


Parameters (Session):
par1 = 48 ; par2 = 1 ; par3 = 1 ; par4 = 0 ; par5 = 12 ; par6 = White Noise ; par7 = 0.95 ;
Parameters (R input):
par1 = 48 ; par2 = 1 ; par3 = 1 ; par4 = 0 ; par5 = 12 ; par6 = White Noise ; par7 = 0.95 ; par8 = ;
R code (references can be found in the software module):
if (par1 == 'Default') {
par1 = 10*log10(length(x))
} else {
par1 <- as.numeric(par1)
}
par2 <- as.numeric(par2)
par3 <- as.numeric(par3)
par4 <- as.numeric(par4)
par5 <- as.numeric(par5)
if (par6 == 'White Noise') par6 <- 'white' else par6 <- 'ma'
par7 <- as.numeric(par7)
if (par8 != '') par8 <- as.numeric(par8)
ox <- x
if (par8 == '') {
if (par2 == 0) {
x <- log(x)
} else {
x <- (x ^ par2 - 1) / par2
}
} else {
x <- log(x,base=par8)
}
if (par3 > 0) x <- diff(x,lag=1,difference=par3)
if (par4 > 0) x <- diff(x,lag=par5,difference=par4)
bitmap(file='picts.png')
op <- par(mfrow=c(2,1))
plot(ox,type='l',main='Original Time Series',xlab='time',ylab='value')
if (par8=='') {
mytitle <- paste('Working Time Series (lambda=',par2,', d=',par3,', D=',par4,')',sep='')
mysub <- paste('(lambda=',par2,', d=',par3,', D=',par4,', CI=', par7, ', CI type=',par6,')',sep='')
} else {
mytitle <- paste('Working Time Series (base=',par8,', d=',par3,', D=',par4,')',sep='')
mysub <- paste('(base=',par8,', d=',par3,', D=',par4,', CI=', par7, ', CI type=',par6,')',sep='')
}
plot(x,type='l', main=mytitle,xlab='time',ylab='value')
par(op)
dev.off()
bitmap(file='pic1.png')
racf <- acf(x, par1, main='Autocorrelation', xlab='time lag', ylab='ACF', ci.type=par6, ci=par7, sub=mysub)
dev.off()
bitmap(file='pic2.png')
rpacf <- pacf(x,par1,main='Partial Autocorrelation',xlab='lags',ylab='PACF',sub=mysub)
dev.off()
(myacf <- c(racf$acf))
(mypacf <- c(rpacf$acf))
lengthx <- length(x)
sqrtn <- sqrt(lengthx)
load(file='createtable')
a<-table.start()
a<-table.row.start(a)
a<-table.element(a,'Autocorrelation Function',4,TRUE)
a<-table.row.end(a)
a<-table.row.start(a)
a<-table.element(a,'Time lag k',header=TRUE)
a<-table.element(a,hyperlink('basics.htm','ACF(k)','click here for more information about the Autocorrelation Function'),header=TRUE)
a<-table.element(a,'T-STAT',header=TRUE)
a<-table.element(a,'P-value',header=TRUE)
a<-table.row.end(a)
for (i in 2:(par1+1)) {
a<-table.row.start(a)
a<-table.element(a,i-1,header=TRUE)
a<-table.element(a,round(myacf[i],6))
mytstat <- myacf[i]*sqrtn
a<-table.element(a,round(mytstat,4))
a<-table.element(a,round(1-pt(abs(mytstat),lengthx),6))
a<-table.row.end(a)
}
a<-table.end(a)
table.save(a,file='mytable.tab')
a<-table.start()
a<-table.row.start(a)
a<-table.element(a,'Partial Autocorrelation Function',4,TRUE)
a<-table.row.end(a)
a<-table.row.start(a)
a<-table.element(a,'Time lag k',header=TRUE)
a<-table.element(a,hyperlink('basics.htm','PACF(k)','click here for more information about the Partial Autocorrelation Function'),header=TRUE)
a<-table.element(a,'T-STAT',header=TRUE)
a<-table.element(a,'P-value',header=TRUE)
a<-table.row.end(a)
for (i in 1:par1) {
a<-table.row.start(a)
a<-table.element(a,i,header=TRUE)
a<-table.element(a,round(mypacf[i],6))
mytstat <- mypacf[i]*sqrtn
a<-table.element(a,round(mytstat,4))
a<-table.element(a,round(1-pt(abs(mytstat),lengthx),6))
a<-table.row.end(a)
}
a<-table.end(a)
table.save(a,file='mytable1.tab')