| Tabulation of Results | ||||
| Depression x Connected | ||||
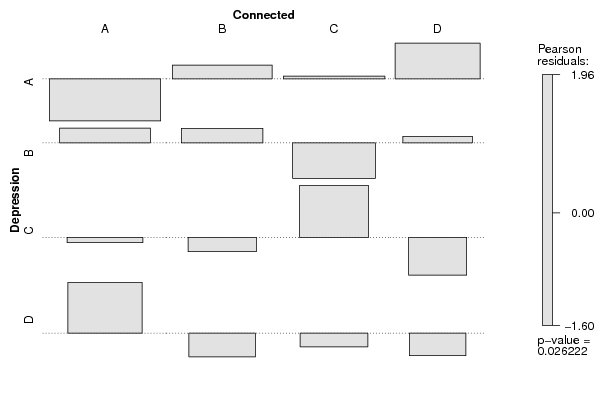
| A | B | C | D | A | 8 | 13 | 12 | 12 | B | 11 | 9 | 4 | 6 | C | 6 | 4 | 10 | 1 | D | 11 | 3 | 4 | 2 |
| Tabulation of Expected Results | ||||
| Depression x Connected | ||||
| A | B | C | D | A | 13.97 | 11.25 | 11.64 | 8.15 | B | 9.31 | 7.5 | 7.76 | 5.43 | C | 6.52 | 5.25 | 5.43 | 3.8 | D | 6.21 | 5 | 5.17 | 3.62 |
| Statistical Results | |
| Pearson's Chi-squared test | |
| Pearson Chi Square Statistic | 18.88 |
| Degrees of Freedom | 9 |
| P value | 0.03 |