| Tabulation of Results | ||||
| Belonging x Belonging_Final | ||||
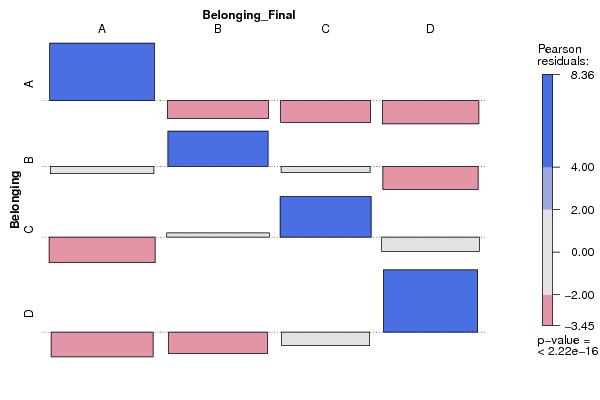
| A | B | C | D | A | 38 | 3 | 0 | 0 | B | 8 | 26 | 6 | 0 | C | 0 | 13 | 25 | 4 | D | 0 | 1 | 3 | 35 |
| Tabulation of Expected Results | ||||
| Belonging x Belonging_Final | ||||
| A | B | C | D | A | 11.64 | 10.88 | 8.6 | 9.87 | B | 11.36 | 10.62 | 8.4 | 9.63 | C | 11.93 | 11.15 | 8.81 | 10.11 | D | 11.07 | 10.35 | 8.19 | 9.39 |
| Statistical Results | |
| Pearson's Chi-squared test | |
| Pearson Chi Square Statistic | 255.77 |
| Degrees of Freedom | 9 |
| P value | 0 |