| Tabulation of Results | |||
| Learning x Software | |||
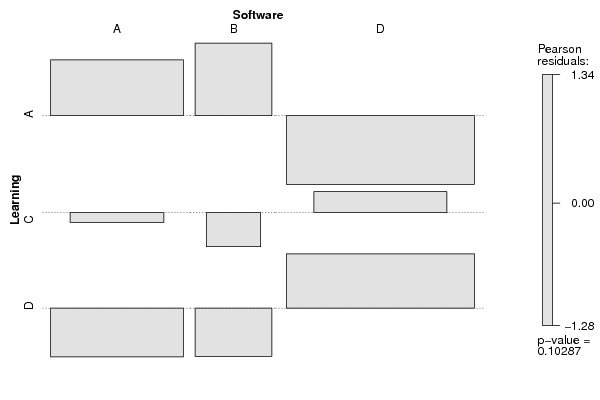
| A | B | D | A | 4 | 2 | 2 | C | 1 | 0 | 3 | D | 1 | 0 | 7 |
| Tabulation of Expected Results | |||
| Learning x Software | |||
| A | B | D | A | 2.4 | 0.8 | 4.8 | C | 1.2 | 0.4 | 2.4 | D | 2.4 | 0.8 | 4.8 |
| Statistical Results | |
| Pearson's Chi-squared test | |
| Pearson Chi Square Statistic | 7.71 |
| Degrees of Freedom | 4 |
| P value | 0.1 |