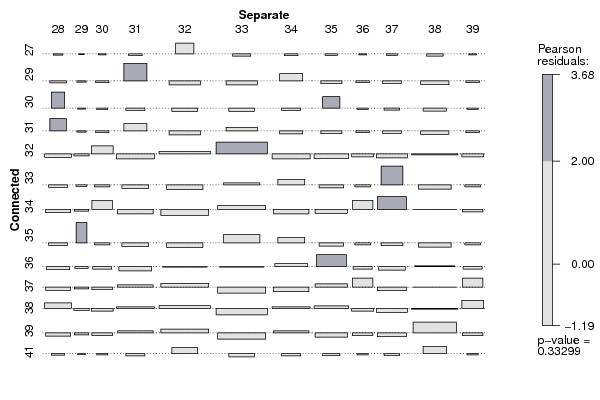
| Tabulation of Results | ||||||||||||
| Connected x Separate | ||||||||||||
| 28 | 29 | 30 | 31 | 32 | 33 | 34 | 35 | 36 | 37 | 38 | 39 | 27 | 0 | 0 | 0 | 0 | 1 | 0 | 0 | 0 | 0 | 0 | 0 | 0 | 29 | 0 | 0 | 0 | 2 | 0 | 0 | 1 | 0 | 0 | 0 | 0 | 0 | 30 | 1 | 0 | 0 | 0 | 0 | 0 | 0 | 1 | 0 | 0 | 0 | 0 | 31 | 1 | 0 | 0 | 1 | 0 | 1 | 0 | 0 | 0 | 0 | 0 | 0 | 32 | 0 | 0 | 1 | 0 | 2 | 4 | 0 | 0 | 0 | 0 | 1 | 0 | 33 | 0 | 0 | 0 | 0 | 0 | 1 | 1 | 0 | 0 | 2 | 0 | 0 | 34 | 0 | 0 | 1 | 0 | 0 | 2 | 0 | 0 | 1 | 2 | 1 | 0 | 35 | 0 | 1 | 0 | 0 | 0 | 2 | 1 | 0 | 0 | 0 | 0 | 0 | 36 | 0 | 0 | 0 | 0 | 1 | 1 | 1 | 2 | 0 | 0 | 1 | 0 | 37 | 0 | 0 | 0 | 1 | 2 | 0 | 0 | 1 | 1 | 0 | 1 | 1 | 38 | 1 | 0 | 0 | 1 | 2 | 0 | 1 | 1 | 0 | 0 | 1 | 1 | 39 | 0 | 0 | 0 | 1 | 2 | 0 | 1 | 0 | 0 | 0 | 3 | 0 | 41 | 0 | 0 | 0 | 0 | 1 | 0 | 0 | 0 | 0 | 0 | 1 | 0 |
| Tabulation of Expected Results | ||||||||||||
| Connected x Separate | ||||||||||||
| 28 | 29 | 30 | 31 | 32 | 33 | 34 | 35 | 36 | 37 | 38 | 39 | 27 | 0.05 | 0.02 | 0.03 | 0.1 | 0.18 | 0.18 | 0.1 | 0.08 | 0.03 | 0.06 | 0.15 | 0.03 | 29 | 0.15 | 0.05 | 0.1 | 0.29 | 0.53 | 0.53 | 0.29 | 0.24 | 0.1 | 0.19 | 0.44 | 0.1 | 30 | 0.1 | 0.03 | 0.06 | 0.19 | 0.35 | 0.35 | 0.19 | 0.16 | 0.06 | 0.13 | 0.29 | 0.06 | 31 | 0.15 | 0.05 | 0.1 | 0.29 | 0.53 | 0.53 | 0.29 | 0.24 | 0.1 | 0.19 | 0.44 | 0.1 | 32 | 0.39 | 0.13 | 0.26 | 0.77 | 1.42 | 1.42 | 0.77 | 0.65 | 0.26 | 0.52 | 1.16 | 0.26 | 33 | 0.19 | 0.06 | 0.13 | 0.39 | 0.71 | 0.71 | 0.39 | 0.32 | 0.13 | 0.26 | 0.58 | 0.13 | 34 | 0.34 | 0.11 | 0.23 | 0.68 | 1.24 | 1.24 | 0.68 | 0.56 | 0.23 | 0.45 | 1.02 | 0.23 | 35 | 0.19 | 0.06 | 0.13 | 0.39 | 0.71 | 0.71 | 0.39 | 0.32 | 0.13 | 0.26 | 0.58 | 0.13 | 36 | 0.29 | 0.1 | 0.19 | 0.58 | 1.06 | 1.06 | 0.58 | 0.48 | 0.19 | 0.39 | 0.87 | 0.19 | 37 | 0.34 | 0.11 | 0.23 | 0.68 | 1.24 | 1.24 | 0.68 | 0.56 | 0.23 | 0.45 | 1.02 | 0.23 | 38 | 0.39 | 0.13 | 0.26 | 0.77 | 1.42 | 1.42 | 0.77 | 0.65 | 0.26 | 0.52 | 1.16 | 0.26 | 39 | 0.34 | 0.11 | 0.23 | 0.68 | 1.24 | 1.24 | 0.68 | 0.56 | 0.23 | 0.45 | 1.02 | 0.23 | 41 | 0.1 | 0.03 | 0.06 | 0.19 | 0.35 | 0.35 | 0.19 | 0.16 | 0.06 | 0.13 | 0.29 | 0.06 |
| Statistical Results | |
| Pearson's Chi-squared test | |
| Pearson Chi Square Statistic | 138.45 |
| Degrees of Freedom | 132 |
| P value | 0.33 |