Free Statistics

of Irreproducible Research!

Author's title

Author*Unverified author*
R Software Modulerwasp_autocorrelation.wasp
Title produced by software(Partial) Autocorrelation Function
Date of computationWed, 16 Nov 2011 08:33:03 -0500
Cite this page as followsStatistical Computations at FreeStatistics.org, Office for Research Development and Education, URL https://freestatistics.org/blog/index.php?v=date/2011/Nov/16/t1321450433xtgz5tpwm8vosbp.htm/, Retrieved Thu, 25 Apr 2024 03:35:50 +0000
Statistical Computations at FreeStatistics.org, Office for Research Development and Education, URL https://freestatistics.org/blog/index.php?pk=143885, Retrieved Thu, 25 Apr 2024 03:35:50 +0000
QR Codes:

Original text written by user:
IsPrivate?No (this computation is public)
User-defined keywordsKDGP2W11
Estimated Impact77
Family? (F = Feedback message, R = changed R code, M = changed R Module, P = changed Parameters, D = changed Data)
-       [(Partial) Autocorrelation Function] [] [2011-11-16 13:33:03] [00ac914fda573751cd779017970949c5] [Current]
Feedback Forum

Post a new message
Dataseries X:
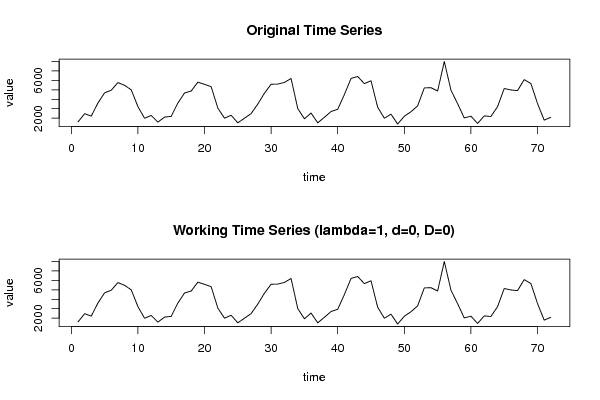
1594
2467
2222
3607
4685
4962
5770
5480
5000
3228
1993
2288
1580
2111
2192
3601
4665
4876
5813
5589
5331
3075
2002
2306
1507
1992
2487
3490
4647
5594
5611
5788
6204
3013
1931
2549
1504
2090
2702
2939
4500
6208
6415
5657
5964
3163
1997
2422
1376
2202
2683
3303
5202
5231
4880
7998
4977
3531
2025
2205
1442
2238
2179
3218
5139
4990
4914
6084
5672
3548
1793
2086


Summary of computational transaction
Raw Inputview raw input (R code)
Raw Outputview raw output of R engine
Computing time1 seconds
R Server'Gertrude Mary Cox' @ cox.wessa.net

\begin{tabular}{lllllllll}
\hline
Summary of computational transaction \tabularnewline
Raw Input & view raw input (R code)  \tabularnewline
Raw Output & view raw output of R engine  \tabularnewline
Computing time & 1 seconds \tabularnewline
R Server & 'Gertrude Mary Cox' @ cox.wessa.net \tabularnewline
\hline
\end{tabular}
%Source: https://freestatistics.org/blog/index.php?pk=143885&T=0

[TABLE]
[ROW][C]Summary of computational transaction[/C][/ROW]
[ROW][C]Raw Input[/C][C]view raw input (R code) [/C][/ROW]
[ROW][C]Raw Output[/C][C]view raw output of R engine [/C][/ROW]
[ROW][C]Computing time[/C][C]1 seconds[/C][/ROW]
[ROW][C]R Server[/C][C]'Gertrude Mary Cox' @ cox.wessa.net[/C][/ROW]
[/TABLE]
Source: https://freestatistics.org/blog/index.php?pk=143885&T=0

Globally Unique Identifier (entire table): ba.freestatistics.org/blog/index.php?pk=143885&T=0

As an alternative you can also use a QR Code:  

The GUIDs for individual cells are displayed in the table below:

Summary of computational transaction
Raw Inputview raw input (R code)
Raw Outputview raw output of R engine
Computing time1 seconds
R Server'Gertrude Mary Cox' @ cox.wessa.net


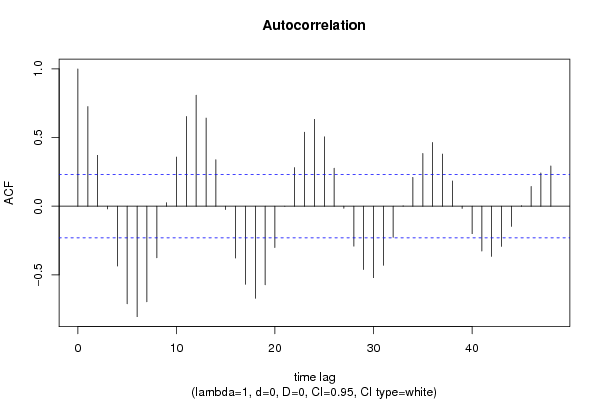
Autocorrelation Function
Time lag kACF(k)T-STATP-value
10.725456.15570
20.370613.14470.001208
3-0.019228-0.16320.435427
4-0.435194-3.69270.000214
5-0.709809-6.02290
6-0.804328-6.8250
7-0.695597-5.90230
8-0.374794-3.18020.001086
90.0249480.21170.416474
100.3576963.03520.001672
110.653965.5490
120.8079236.85550
130.6420385.44790
140.339022.87670.002642
15-0.024277-0.2060.418686
16-0.377477-3.2030.001013
17-0.567831-4.81824e-06
18-0.670574-5.690
19-0.572534-4.85813e-06
20-0.30098-2.55390.006385
21-0.000699-0.00590.497642
220.2813232.38710.009805
230.538524.56951e-05
240.632795.36940
250.505444.28882.7e-05
260.2769712.35020.010754
27-0.01473-0.1250.450441
28-0.290618-2.4660.008023
29-0.460579-3.90810.000104
30-0.520116-4.41331.8e-05
31-0.430208-3.65040.000246
32-0.226025-1.91790.029546
330.0010250.00870.496541
340.2100221.78210.039475
350.3838553.25710.000859
360.4642053.93899.4e-05
370.3794893.22010.000962
380.1843371.56420.061083
39-0.015547-0.13190.447709
40-0.19971-1.69460.047237
41-0.325995-2.76620.003601
42-0.365113-3.09810.001389
43-0.292286-2.48010.007737
44-0.147093-1.24810.108014
450.003710.03150.487485
460.1435851.21840.113532
470.2415312.04950.022031
480.293282.48860.00757

\begin{tabular}{lllllllll}
\hline
Autocorrelation Function \tabularnewline
Time lag k & ACF(k) & T-STAT & P-value \tabularnewline
1 & 0.72545 & 6.1557 & 0 \tabularnewline
2 & 0.37061 & 3.1447 & 0.001208 \tabularnewline
3 & -0.019228 & -0.1632 & 0.435427 \tabularnewline
4 & -0.435194 & -3.6927 & 0.000214 \tabularnewline
5 & -0.709809 & -6.0229 & 0 \tabularnewline
6 & -0.804328 & -6.825 & 0 \tabularnewline
7 & -0.695597 & -5.9023 & 0 \tabularnewline
8 & -0.374794 & -3.1802 & 0.001086 \tabularnewline
9 & 0.024948 & 0.2117 & 0.416474 \tabularnewline
10 & 0.357696 & 3.0352 & 0.001672 \tabularnewline
11 & 0.65396 & 5.549 & 0 \tabularnewline
12 & 0.807923 & 6.8555 & 0 \tabularnewline
13 & 0.642038 & 5.4479 & 0 \tabularnewline
14 & 0.33902 & 2.8767 & 0.002642 \tabularnewline
15 & -0.024277 & -0.206 & 0.418686 \tabularnewline
16 & -0.377477 & -3.203 & 0.001013 \tabularnewline
17 & -0.567831 & -4.8182 & 4e-06 \tabularnewline
18 & -0.670574 & -5.69 & 0 \tabularnewline
19 & -0.572534 & -4.8581 & 3e-06 \tabularnewline
20 & -0.30098 & -2.5539 & 0.006385 \tabularnewline
21 & -0.000699 & -0.0059 & 0.497642 \tabularnewline
22 & 0.281323 & 2.3871 & 0.009805 \tabularnewline
23 & 0.53852 & 4.5695 & 1e-05 \tabularnewline
24 & 0.63279 & 5.3694 & 0 \tabularnewline
25 & 0.50544 & 4.2888 & 2.7e-05 \tabularnewline
26 & 0.276971 & 2.3502 & 0.010754 \tabularnewline
27 & -0.01473 & -0.125 & 0.450441 \tabularnewline
28 & -0.290618 & -2.466 & 0.008023 \tabularnewline
29 & -0.460579 & -3.9081 & 0.000104 \tabularnewline
30 & -0.520116 & -4.4133 & 1.8e-05 \tabularnewline
31 & -0.430208 & -3.6504 & 0.000246 \tabularnewline
32 & -0.226025 & -1.9179 & 0.029546 \tabularnewline
33 & 0.001025 & 0.0087 & 0.496541 \tabularnewline
34 & 0.210022 & 1.7821 & 0.039475 \tabularnewline
35 & 0.383855 & 3.2571 & 0.000859 \tabularnewline
36 & 0.464205 & 3.9389 & 9.4e-05 \tabularnewline
37 & 0.379489 & 3.2201 & 0.000962 \tabularnewline
38 & 0.184337 & 1.5642 & 0.061083 \tabularnewline
39 & -0.015547 & -0.1319 & 0.447709 \tabularnewline
40 & -0.19971 & -1.6946 & 0.047237 \tabularnewline
41 & -0.325995 & -2.7662 & 0.003601 \tabularnewline
42 & -0.365113 & -3.0981 & 0.001389 \tabularnewline
43 & -0.292286 & -2.4801 & 0.007737 \tabularnewline
44 & -0.147093 & -1.2481 & 0.108014 \tabularnewline
45 & 0.00371 & 0.0315 & 0.487485 \tabularnewline
46 & 0.143585 & 1.2184 & 0.113532 \tabularnewline
47 & 0.241531 & 2.0495 & 0.022031 \tabularnewline
48 & 0.29328 & 2.4886 & 0.00757 \tabularnewline
\hline
\end{tabular}
%Source: https://freestatistics.org/blog/index.php?pk=143885&T=1

[TABLE]
[ROW][C]Autocorrelation Function[/C][/ROW]
[ROW][C]Time lag k[/C][C]ACF(k)[/C][C]T-STAT[/C][C]P-value[/C][/ROW]
[ROW][C]1[/C][C]0.72545[/C][C]6.1557[/C][C]0[/C][/ROW]
[ROW][C]2[/C][C]0.37061[/C][C]3.1447[/C][C]0.001208[/C][/ROW]
[ROW][C]3[/C][C]-0.019228[/C][C]-0.1632[/C][C]0.435427[/C][/ROW]
[ROW][C]4[/C][C]-0.435194[/C][C]-3.6927[/C][C]0.000214[/C][/ROW]
[ROW][C]5[/C][C]-0.709809[/C][C]-6.0229[/C][C]0[/C][/ROW]
[ROW][C]6[/C][C]-0.804328[/C][C]-6.825[/C][C]0[/C][/ROW]
[ROW][C]7[/C][C]-0.695597[/C][C]-5.9023[/C][C]0[/C][/ROW]
[ROW][C]8[/C][C]-0.374794[/C][C]-3.1802[/C][C]0.001086[/C][/ROW]
[ROW][C]9[/C][C]0.024948[/C][C]0.2117[/C][C]0.416474[/C][/ROW]
[ROW][C]10[/C][C]0.357696[/C][C]3.0352[/C][C]0.001672[/C][/ROW]
[ROW][C]11[/C][C]0.65396[/C][C]5.549[/C][C]0[/C][/ROW]
[ROW][C]12[/C][C]0.807923[/C][C]6.8555[/C][C]0[/C][/ROW]
[ROW][C]13[/C][C]0.642038[/C][C]5.4479[/C][C]0[/C][/ROW]
[ROW][C]14[/C][C]0.33902[/C][C]2.8767[/C][C]0.002642[/C][/ROW]
[ROW][C]15[/C][C]-0.024277[/C][C]-0.206[/C][C]0.418686[/C][/ROW]
[ROW][C]16[/C][C]-0.377477[/C][C]-3.203[/C][C]0.001013[/C][/ROW]
[ROW][C]17[/C][C]-0.567831[/C][C]-4.8182[/C][C]4e-06[/C][/ROW]
[ROW][C]18[/C][C]-0.670574[/C][C]-5.69[/C][C]0[/C][/ROW]
[ROW][C]19[/C][C]-0.572534[/C][C]-4.8581[/C][C]3e-06[/C][/ROW]
[ROW][C]20[/C][C]-0.30098[/C][C]-2.5539[/C][C]0.006385[/C][/ROW]
[ROW][C]21[/C][C]-0.000699[/C][C]-0.0059[/C][C]0.497642[/C][/ROW]
[ROW][C]22[/C][C]0.281323[/C][C]2.3871[/C][C]0.009805[/C][/ROW]
[ROW][C]23[/C][C]0.53852[/C][C]4.5695[/C][C]1e-05[/C][/ROW]
[ROW][C]24[/C][C]0.63279[/C][C]5.3694[/C][C]0[/C][/ROW]
[ROW][C]25[/C][C]0.50544[/C][C]4.2888[/C][C]2.7e-05[/C][/ROW]
[ROW][C]26[/C][C]0.276971[/C][C]2.3502[/C][C]0.010754[/C][/ROW]
[ROW][C]27[/C][C]-0.01473[/C][C]-0.125[/C][C]0.450441[/C][/ROW]
[ROW][C]28[/C][C]-0.290618[/C][C]-2.466[/C][C]0.008023[/C][/ROW]
[ROW][C]29[/C][C]-0.460579[/C][C]-3.9081[/C][C]0.000104[/C][/ROW]
[ROW][C]30[/C][C]-0.520116[/C][C]-4.4133[/C][C]1.8e-05[/C][/ROW]
[ROW][C]31[/C][C]-0.430208[/C][C]-3.6504[/C][C]0.000246[/C][/ROW]
[ROW][C]32[/C][C]-0.226025[/C][C]-1.9179[/C][C]0.029546[/C][/ROW]
[ROW][C]33[/C][C]0.001025[/C][C]0.0087[/C][C]0.496541[/C][/ROW]
[ROW][C]34[/C][C]0.210022[/C][C]1.7821[/C][C]0.039475[/C][/ROW]
[ROW][C]35[/C][C]0.383855[/C][C]3.2571[/C][C]0.000859[/C][/ROW]
[ROW][C]36[/C][C]0.464205[/C][C]3.9389[/C][C]9.4e-05[/C][/ROW]
[ROW][C]37[/C][C]0.379489[/C][C]3.2201[/C][C]0.000962[/C][/ROW]
[ROW][C]38[/C][C]0.184337[/C][C]1.5642[/C][C]0.061083[/C][/ROW]
[ROW][C]39[/C][C]-0.015547[/C][C]-0.1319[/C][C]0.447709[/C][/ROW]
[ROW][C]40[/C][C]-0.19971[/C][C]-1.6946[/C][C]0.047237[/C][/ROW]
[ROW][C]41[/C][C]-0.325995[/C][C]-2.7662[/C][C]0.003601[/C][/ROW]
[ROW][C]42[/C][C]-0.365113[/C][C]-3.0981[/C][C]0.001389[/C][/ROW]
[ROW][C]43[/C][C]-0.292286[/C][C]-2.4801[/C][C]0.007737[/C][/ROW]
[ROW][C]44[/C][C]-0.147093[/C][C]-1.2481[/C][C]0.108014[/C][/ROW]
[ROW][C]45[/C][C]0.00371[/C][C]0.0315[/C][C]0.487485[/C][/ROW]
[ROW][C]46[/C][C]0.143585[/C][C]1.2184[/C][C]0.113532[/C][/ROW]
[ROW][C]47[/C][C]0.241531[/C][C]2.0495[/C][C]0.022031[/C][/ROW]
[ROW][C]48[/C][C]0.29328[/C][C]2.4886[/C][C]0.00757[/C][/ROW]
[/TABLE]
Source: https://freestatistics.org/blog/index.php?pk=143885&T=1

Globally Unique Identifier (entire table): ba.freestatistics.org/blog/index.php?pk=143885&T=1

As an alternative you can also use a QR Code:  

The GUIDs for individual cells are displayed in the table below:

Autocorrelation Function
Time lag kACF(k)T-STATP-value
10.725456.15570
20.370613.14470.001208
3-0.019228-0.16320.435427
4-0.435194-3.69270.000214
5-0.709809-6.02290
6-0.804328-6.8250
7-0.695597-5.90230
8-0.374794-3.18020.001086
90.0249480.21170.416474
100.3576963.03520.001672
110.653965.5490
120.8079236.85550
130.6420385.44790
140.339022.87670.002642
15-0.024277-0.2060.418686
16-0.377477-3.2030.001013
17-0.567831-4.81824e-06
18-0.670574-5.690
19-0.572534-4.85813e-06
20-0.30098-2.55390.006385
21-0.000699-0.00590.497642
220.2813232.38710.009805
230.538524.56951e-05
240.632795.36940
250.505444.28882.7e-05
260.2769712.35020.010754
27-0.01473-0.1250.450441
28-0.290618-2.4660.008023
29-0.460579-3.90810.000104
30-0.520116-4.41331.8e-05
31-0.430208-3.65040.000246
32-0.226025-1.91790.029546
330.0010250.00870.496541
340.2100221.78210.039475
350.3838553.25710.000859
360.4642053.93899.4e-05
370.3794893.22010.000962
380.1843371.56420.061083
39-0.015547-0.13190.447709
40-0.19971-1.69460.047237
41-0.325995-2.76620.003601
42-0.365113-3.09810.001389
43-0.292286-2.48010.007737
44-0.147093-1.24810.108014
450.003710.03150.487485
460.1435851.21840.113532
470.2415312.04950.022031
480.293282.48860.00757


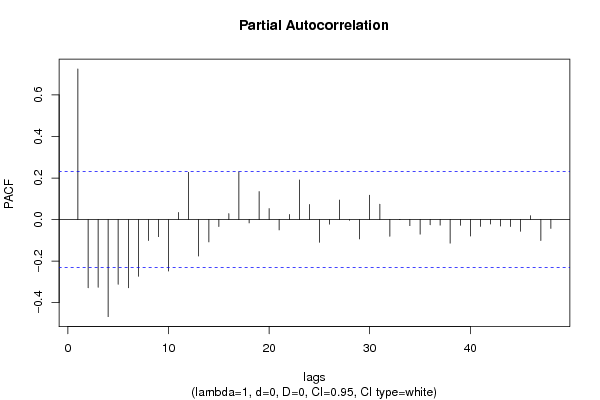
Partial Autocorrelation Function
Time lag kPACF(k)T-STATP-value
10.725456.15570
2-0.328607-2.78830.003386
3-0.326688-2.7720.003543
4-0.467959-3.97088.4e-05
5-0.311982-2.64730.004981
6-0.328923-2.7910.003361
7-0.273039-2.31680.011681
8-0.101413-0.86050.19618
9-0.082636-0.70120.242723
10-0.248037-2.10470.019406
110.03380.28680.387545
120.2273181.92890.028845
13-0.175725-1.49110.070155
14-0.107655-0.91350.182018
15-0.033295-0.28250.389177
160.028290.240.405489
170.2302341.95360.027317
18-0.016337-0.13860.445068
190.1345361.14160.128706
200.052650.44680.328198
21-0.050055-0.42470.336151
220.0243130.20630.418568
230.1905441.61680.055145
240.0726980.61690.269636
25-0.109853-0.93210.177192
26-0.022294-0.18920.425247
270.0935580.79390.214941
28-0.003841-0.03260.487046
29-0.093241-0.79120.215721
300.1166680.990.162754
310.0735220.62390.267347
32-0.080447-0.68260.24852
33-0.000766-0.00650.497417
34-0.029545-0.25070.40138
35-0.070334-0.59680.276256
36-0.025174-0.21360.415728
37-0.027068-0.22970.409496
38-0.113686-0.96470.168972
39-0.027494-0.23330.408096
40-0.079242-0.67240.251744
41-0.033016-0.28010.390083
42-0.021594-0.18320.427565
43-0.031515-0.26740.394958
44-0.033737-0.28630.387747
45-0.056462-0.47910.31666
460.0179250.15210.439768
47-0.1008-0.85530.197606
48-0.042688-0.36220.359124

\begin{tabular}{lllllllll}
\hline
Partial Autocorrelation Function \tabularnewline
Time lag k & PACF(k) & T-STAT & P-value \tabularnewline
1 & 0.72545 & 6.1557 & 0 \tabularnewline
2 & -0.328607 & -2.7883 & 0.003386 \tabularnewline
3 & -0.326688 & -2.772 & 0.003543 \tabularnewline
4 & -0.467959 & -3.9708 & 8.4e-05 \tabularnewline
5 & -0.311982 & -2.6473 & 0.004981 \tabularnewline
6 & -0.328923 & -2.791 & 0.003361 \tabularnewline
7 & -0.273039 & -2.3168 & 0.011681 \tabularnewline
8 & -0.101413 & -0.8605 & 0.19618 \tabularnewline
9 & -0.082636 & -0.7012 & 0.242723 \tabularnewline
10 & -0.248037 & -2.1047 & 0.019406 \tabularnewline
11 & 0.0338 & 0.2868 & 0.387545 \tabularnewline
12 & 0.227318 & 1.9289 & 0.028845 \tabularnewline
13 & -0.175725 & -1.4911 & 0.070155 \tabularnewline
14 & -0.107655 & -0.9135 & 0.182018 \tabularnewline
15 & -0.033295 & -0.2825 & 0.389177 \tabularnewline
16 & 0.02829 & 0.24 & 0.405489 \tabularnewline
17 & 0.230234 & 1.9536 & 0.027317 \tabularnewline
18 & -0.016337 & -0.1386 & 0.445068 \tabularnewline
19 & 0.134536 & 1.1416 & 0.128706 \tabularnewline
20 & 0.05265 & 0.4468 & 0.328198 \tabularnewline
21 & -0.050055 & -0.4247 & 0.336151 \tabularnewline
22 & 0.024313 & 0.2063 & 0.418568 \tabularnewline
23 & 0.190544 & 1.6168 & 0.055145 \tabularnewline
24 & 0.072698 & 0.6169 & 0.269636 \tabularnewline
25 & -0.109853 & -0.9321 & 0.177192 \tabularnewline
26 & -0.022294 & -0.1892 & 0.425247 \tabularnewline
27 & 0.093558 & 0.7939 & 0.214941 \tabularnewline
28 & -0.003841 & -0.0326 & 0.487046 \tabularnewline
29 & -0.093241 & -0.7912 & 0.215721 \tabularnewline
30 & 0.116668 & 0.99 & 0.162754 \tabularnewline
31 & 0.073522 & 0.6239 & 0.267347 \tabularnewline
32 & -0.080447 & -0.6826 & 0.24852 \tabularnewline
33 & -0.000766 & -0.0065 & 0.497417 \tabularnewline
34 & -0.029545 & -0.2507 & 0.40138 \tabularnewline
35 & -0.070334 & -0.5968 & 0.276256 \tabularnewline
36 & -0.025174 & -0.2136 & 0.415728 \tabularnewline
37 & -0.027068 & -0.2297 & 0.409496 \tabularnewline
38 & -0.113686 & -0.9647 & 0.168972 \tabularnewline
39 & -0.027494 & -0.2333 & 0.408096 \tabularnewline
40 & -0.079242 & -0.6724 & 0.251744 \tabularnewline
41 & -0.033016 & -0.2801 & 0.390083 \tabularnewline
42 & -0.021594 & -0.1832 & 0.427565 \tabularnewline
43 & -0.031515 & -0.2674 & 0.394958 \tabularnewline
44 & -0.033737 & -0.2863 & 0.387747 \tabularnewline
45 & -0.056462 & -0.4791 & 0.31666 \tabularnewline
46 & 0.017925 & 0.1521 & 0.439768 \tabularnewline
47 & -0.1008 & -0.8553 & 0.197606 \tabularnewline
48 & -0.042688 & -0.3622 & 0.359124 \tabularnewline
\hline
\end{tabular}
%Source: https://freestatistics.org/blog/index.php?pk=143885&T=2

[TABLE]
[ROW][C]Partial Autocorrelation Function[/C][/ROW]
[ROW][C]Time lag k[/C][C]PACF(k)[/C][C]T-STAT[/C][C]P-value[/C][/ROW]
[ROW][C]1[/C][C]0.72545[/C][C]6.1557[/C][C]0[/C][/ROW]
[ROW][C]2[/C][C]-0.328607[/C][C]-2.7883[/C][C]0.003386[/C][/ROW]
[ROW][C]3[/C][C]-0.326688[/C][C]-2.772[/C][C]0.003543[/C][/ROW]
[ROW][C]4[/C][C]-0.467959[/C][C]-3.9708[/C][C]8.4e-05[/C][/ROW]
[ROW][C]5[/C][C]-0.311982[/C][C]-2.6473[/C][C]0.004981[/C][/ROW]
[ROW][C]6[/C][C]-0.328923[/C][C]-2.791[/C][C]0.003361[/C][/ROW]
[ROW][C]7[/C][C]-0.273039[/C][C]-2.3168[/C][C]0.011681[/C][/ROW]
[ROW][C]8[/C][C]-0.101413[/C][C]-0.8605[/C][C]0.19618[/C][/ROW]
[ROW][C]9[/C][C]-0.082636[/C][C]-0.7012[/C][C]0.242723[/C][/ROW]
[ROW][C]10[/C][C]-0.248037[/C][C]-2.1047[/C][C]0.019406[/C][/ROW]
[ROW][C]11[/C][C]0.0338[/C][C]0.2868[/C][C]0.387545[/C][/ROW]
[ROW][C]12[/C][C]0.227318[/C][C]1.9289[/C][C]0.028845[/C][/ROW]
[ROW][C]13[/C][C]-0.175725[/C][C]-1.4911[/C][C]0.070155[/C][/ROW]
[ROW][C]14[/C][C]-0.107655[/C][C]-0.9135[/C][C]0.182018[/C][/ROW]
[ROW][C]15[/C][C]-0.033295[/C][C]-0.2825[/C][C]0.389177[/C][/ROW]
[ROW][C]16[/C][C]0.02829[/C][C]0.24[/C][C]0.405489[/C][/ROW]
[ROW][C]17[/C][C]0.230234[/C][C]1.9536[/C][C]0.027317[/C][/ROW]
[ROW][C]18[/C][C]-0.016337[/C][C]-0.1386[/C][C]0.445068[/C][/ROW]
[ROW][C]19[/C][C]0.134536[/C][C]1.1416[/C][C]0.128706[/C][/ROW]
[ROW][C]20[/C][C]0.05265[/C][C]0.4468[/C][C]0.328198[/C][/ROW]
[ROW][C]21[/C][C]-0.050055[/C][C]-0.4247[/C][C]0.336151[/C][/ROW]
[ROW][C]22[/C][C]0.024313[/C][C]0.2063[/C][C]0.418568[/C][/ROW]
[ROW][C]23[/C][C]0.190544[/C][C]1.6168[/C][C]0.055145[/C][/ROW]
[ROW][C]24[/C][C]0.072698[/C][C]0.6169[/C][C]0.269636[/C][/ROW]
[ROW][C]25[/C][C]-0.109853[/C][C]-0.9321[/C][C]0.177192[/C][/ROW]
[ROW][C]26[/C][C]-0.022294[/C][C]-0.1892[/C][C]0.425247[/C][/ROW]
[ROW][C]27[/C][C]0.093558[/C][C]0.7939[/C][C]0.214941[/C][/ROW]
[ROW][C]28[/C][C]-0.003841[/C][C]-0.0326[/C][C]0.487046[/C][/ROW]
[ROW][C]29[/C][C]-0.093241[/C][C]-0.7912[/C][C]0.215721[/C][/ROW]
[ROW][C]30[/C][C]0.116668[/C][C]0.99[/C][C]0.162754[/C][/ROW]
[ROW][C]31[/C][C]0.073522[/C][C]0.6239[/C][C]0.267347[/C][/ROW]
[ROW][C]32[/C][C]-0.080447[/C][C]-0.6826[/C][C]0.24852[/C][/ROW]
[ROW][C]33[/C][C]-0.000766[/C][C]-0.0065[/C][C]0.497417[/C][/ROW]
[ROW][C]34[/C][C]-0.029545[/C][C]-0.2507[/C][C]0.40138[/C][/ROW]
[ROW][C]35[/C][C]-0.070334[/C][C]-0.5968[/C][C]0.276256[/C][/ROW]
[ROW][C]36[/C][C]-0.025174[/C][C]-0.2136[/C][C]0.415728[/C][/ROW]
[ROW][C]37[/C][C]-0.027068[/C][C]-0.2297[/C][C]0.409496[/C][/ROW]
[ROW][C]38[/C][C]-0.113686[/C][C]-0.9647[/C][C]0.168972[/C][/ROW]
[ROW][C]39[/C][C]-0.027494[/C][C]-0.2333[/C][C]0.408096[/C][/ROW]
[ROW][C]40[/C][C]-0.079242[/C][C]-0.6724[/C][C]0.251744[/C][/ROW]
[ROW][C]41[/C][C]-0.033016[/C][C]-0.2801[/C][C]0.390083[/C][/ROW]
[ROW][C]42[/C][C]-0.021594[/C][C]-0.1832[/C][C]0.427565[/C][/ROW]
[ROW][C]43[/C][C]-0.031515[/C][C]-0.2674[/C][C]0.394958[/C][/ROW]
[ROW][C]44[/C][C]-0.033737[/C][C]-0.2863[/C][C]0.387747[/C][/ROW]
[ROW][C]45[/C][C]-0.056462[/C][C]-0.4791[/C][C]0.31666[/C][/ROW]
[ROW][C]46[/C][C]0.017925[/C][C]0.1521[/C][C]0.439768[/C][/ROW]
[ROW][C]47[/C][C]-0.1008[/C][C]-0.8553[/C][C]0.197606[/C][/ROW]
[ROW][C]48[/C][C]-0.042688[/C][C]-0.3622[/C][C]0.359124[/C][/ROW]
[/TABLE]
Source: https://freestatistics.org/blog/index.php?pk=143885&T=2

Globally Unique Identifier (entire table): ba.freestatistics.org/blog/index.php?pk=143885&T=2

As an alternative you can also use a QR Code:  

The GUIDs for individual cells are displayed in the table below:

Partial Autocorrelation Function
Time lag kPACF(k)T-STATP-value
10.725456.15570
2-0.328607-2.78830.003386
3-0.326688-2.7720.003543
4-0.467959-3.97088.4e-05
5-0.311982-2.64730.004981
6-0.328923-2.7910.003361
7-0.273039-2.31680.011681
8-0.101413-0.86050.19618
9-0.082636-0.70120.242723
10-0.248037-2.10470.019406
110.03380.28680.387545
120.2273181.92890.028845
13-0.175725-1.49110.070155
14-0.107655-0.91350.182018
15-0.033295-0.28250.389177
160.028290.240.405489
170.2302341.95360.027317
18-0.016337-0.13860.445068
190.1345361.14160.128706
200.052650.44680.328198
21-0.050055-0.42470.336151
220.0243130.20630.418568
230.1905441.61680.055145
240.0726980.61690.269636
25-0.109853-0.93210.177192
26-0.022294-0.18920.425247
270.0935580.79390.214941
28-0.003841-0.03260.487046
29-0.093241-0.79120.215721
300.1166680.990.162754
310.0735220.62390.267347
32-0.080447-0.68260.24852
33-0.000766-0.00650.497417
34-0.029545-0.25070.40138
35-0.070334-0.59680.276256
36-0.025174-0.21360.415728
37-0.027068-0.22970.409496
38-0.113686-0.96470.168972
39-0.027494-0.23330.408096
40-0.079242-0.67240.251744
41-0.033016-0.28010.390083
42-0.021594-0.18320.427565
43-0.031515-0.26740.394958
44-0.033737-0.28630.387747
45-0.056462-0.47910.31666
460.0179250.15210.439768
47-0.1008-0.85530.197606
48-0.042688-0.36220.359124


Parameters (Session):
par1 = 48 ; par2 = 1 ; par3 = 0 ; par4 = 0 ; par5 = 12 ; par6 = White Noise ; par7 = 0.95 ;
Parameters (R input):
par1 = 48 ; par2 = 1 ; par3 = 0 ; par4 = 0 ; par5 = 12 ; par6 = White Noise ; par7 = 0.95 ; par8 = ;
R code (references can be found in the software module):
if (par1 == 'Default') {
par1 = 10*log10(length(x))
} else {
par1 <- as.numeric(par1)
}
par2 <- as.numeric(par2)
par3 <- as.numeric(par3)
par4 <- as.numeric(par4)
par5 <- as.numeric(par5)
if (par6 == 'White Noise') par6 <- 'white' else par6 <- 'ma'
par7 <- as.numeric(par7)
if (par8 != '') par8 <- as.numeric(par8)
ox <- x
if (par8 == '') {
if (par2 == 0) {
x <- log(x)
} else {
x <- (x ^ par2 - 1) / par2
}
} else {
x <- log(x,base=par8)
}
if (par3 > 0) x <- diff(x,lag=1,difference=par3)
if (par4 > 0) x <- diff(x,lag=par5,difference=par4)
bitmap(file='picts.png')
op <- par(mfrow=c(2,1))
plot(ox,type='l',main='Original Time Series',xlab='time',ylab='value')
if (par8=='') {
mytitle <- paste('Working Time Series (lambda=',par2,', d=',par3,', D=',par4,')',sep='')
mysub <- paste('(lambda=',par2,', d=',par3,', D=',par4,', CI=', par7, ', CI type=',par6,')',sep='')
} else {
mytitle <- paste('Working Time Series (base=',par8,', d=',par3,', D=',par4,')',sep='')
mysub <- paste('(base=',par8,', d=',par3,', D=',par4,', CI=', par7, ', CI type=',par6,')',sep='')
}
plot(x,type='l', main=mytitle,xlab='time',ylab='value')
par(op)
dev.off()
bitmap(file='pic1.png')
racf <- acf(x, par1, main='Autocorrelation', xlab='time lag', ylab='ACF', ci.type=par6, ci=par7, sub=mysub)
dev.off()
bitmap(file='pic2.png')
rpacf <- pacf(x,par1,main='Partial Autocorrelation',xlab='lags',ylab='PACF',sub=mysub)
dev.off()
(myacf <- c(racf$acf))
(mypacf <- c(rpacf$acf))
lengthx <- length(x)
sqrtn <- sqrt(lengthx)
load(file='createtable')
a<-table.start()
a<-table.row.start(a)
a<-table.element(a,'Autocorrelation Function',4,TRUE)
a<-table.row.end(a)
a<-table.row.start(a)
a<-table.element(a,'Time lag k',header=TRUE)
a<-table.element(a,hyperlink('basics.htm','ACF(k)','click here for more information about the Autocorrelation Function'),header=TRUE)
a<-table.element(a,'T-STAT',header=TRUE)
a<-table.element(a,'P-value',header=TRUE)
a<-table.row.end(a)
for (i in 2:(par1+1)) {
a<-table.row.start(a)
a<-table.element(a,i-1,header=TRUE)
a<-table.element(a,round(myacf[i],6))
mytstat <- myacf[i]*sqrtn
a<-table.element(a,round(mytstat,4))
a<-table.element(a,round(1-pt(abs(mytstat),lengthx),6))
a<-table.row.end(a)
}
a<-table.end(a)
table.save(a,file='mytable.tab')
a<-table.start()
a<-table.row.start(a)
a<-table.element(a,'Partial Autocorrelation Function',4,TRUE)
a<-table.row.end(a)
a<-table.row.start(a)
a<-table.element(a,'Time lag k',header=TRUE)
a<-table.element(a,hyperlink('basics.htm','PACF(k)','click here for more information about the Partial Autocorrelation Function'),header=TRUE)
a<-table.element(a,'T-STAT',header=TRUE)
a<-table.element(a,'P-value',header=TRUE)
a<-table.row.end(a)
for (i in 1:par1) {
a<-table.row.start(a)
a<-table.element(a,i,header=TRUE)
a<-table.element(a,round(mypacf[i],6))
mytstat <- mypacf[i]*sqrtn
a<-table.element(a,round(mytstat,4))
a<-table.element(a,round(1-pt(abs(mytstat),lengthx),6))
a<-table.row.end(a)
}
a<-table.end(a)
table.save(a,file='mytable1.tab')