Free Statistics

of Irreproducible Research!

Author's title

Author*Unverified author*
R Software Modulerwasp_autocorrelation.wasp
Title produced by software(Partial) Autocorrelation Function
Date of computationWed, 16 Nov 2011 06:50:14 -0500
Cite this page as followsStatistical Computations at FreeStatistics.org, Office for Research Development and Education, URL https://freestatistics.org/blog/index.php?v=date/2011/Nov/16/t1321444378nx5ok38kkx8lxqj.htm/, Retrieved Thu, 18 Apr 2024 23:37:42 +0000
Statistical Computations at FreeStatistics.org, Office for Research Development and Education, URL https://freestatistics.org/blog/index.php?pk=143822, Retrieved Thu, 18 Apr 2024 23:37:42 +0000
QR Codes:

Original text written by user:
IsPrivate?No (this computation is public)
User-defined keywordsKDGP2W12
Estimated Impact77
Family? (F = Feedback message, R = changed R code, M = changed R Module, P = changed Parameters, D = changed Data)
-       [(Partial) Autocorrelation Function] [] [2011-11-16 11:50:14] [3065ee55bdba439201dadf7d5b1a020e] [Current]
Feedback Forum

Post a new message
Dataseries X:
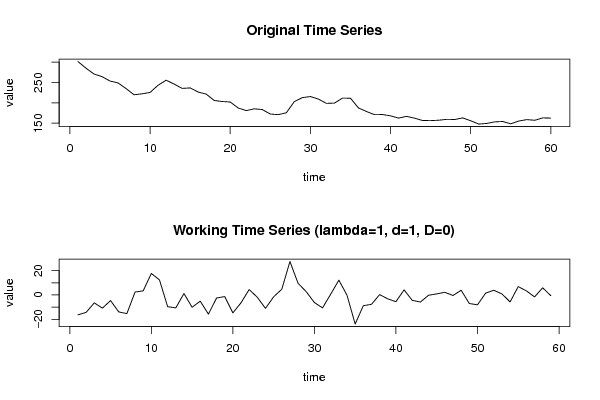
301.5
285.2
270.9
264.4
253.6
249
235.1
219.8
222.2
225.6
243.3
255.7
246.1
235.5
236.7
226.6
221.5
205.8
203.3
202
187.3
180.9
185.4
183.5
172.5
171
175.7
203.2
212.8
215.5
209.3
198.7
199.4
211.6
211.4
187.5
178.7
171
171.3
168.1
162.6
166.8
162.4
156.6
156.4
157.3
159.5
159.1
163
156
147.9
149.4
153.3
154.2
148.5
155.4
158.8
157.2
163.1
162.5


Summary of computational transaction
Raw Inputview raw input (R code)
Raw Outputview raw output of R engine
Computing time1 seconds
R Server'Gwilym Jenkins' @ jenkins.wessa.net

\begin{tabular}{lllllllll}
\hline
Summary of computational transaction \tabularnewline
Raw Input & view raw input (R code)  \tabularnewline
Raw Output & view raw output of R engine  \tabularnewline
Computing time & 1 seconds \tabularnewline
R Server & 'Gwilym Jenkins' @ jenkins.wessa.net \tabularnewline
\hline
\end{tabular}
%Source: https://freestatistics.org/blog/index.php?pk=143822&T=0

[TABLE]
[ROW][C]Summary of computational transaction[/C][/ROW]
[ROW][C]Raw Input[/C][C]view raw input (R code) [/C][/ROW]
[ROW][C]Raw Output[/C][C]view raw output of R engine [/C][/ROW]
[ROW][C]Computing time[/C][C]1 seconds[/C][/ROW]
[ROW][C]R Server[/C][C]'Gwilym Jenkins' @ jenkins.wessa.net[/C][/ROW]
[/TABLE]
Source: https://freestatistics.org/blog/index.php?pk=143822&T=0

Globally Unique Identifier (entire table): ba.freestatistics.org/blog/index.php?pk=143822&T=0

As an alternative you can also use a QR Code:  

The GUIDs for individual cells are displayed in the table below:

Summary of computational transaction
Raw Inputview raw input (R code)
Raw Outputview raw output of R engine
Computing time1 seconds
R Server'Gwilym Jenkins' @ jenkins.wessa.net


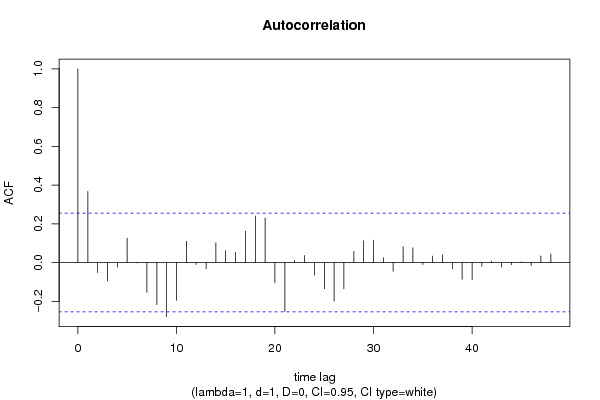
Autocorrelation Function
Time lag kACF(k)T-STATP-value
10.3670022.8190.003274
2-0.051198-0.39330.347774
3-0.095584-0.73420.23287
4-0.022916-0.1760.430439
50.1261330.96880.168289
6-0.001781-0.01370.494566
7-0.153118-1.17610.122135
8-0.217053-1.66720.050386
9-0.27926-2.1450.018039
10-0.194342-1.49280.070413
110.1095320.84130.201779
12-0.010203-0.07840.468898
13-0.031558-0.24240.404655
140.1018720.78250.218527
150.0612450.47040.319891
160.0537940.41320.340479
170.1616291.24150.109667
180.2400211.84360.03513
190.2305341.77080.040883
20-0.103097-0.79190.215796
21-0.252239-1.93750.028739
220.0103460.07950.468463
230.0368550.28310.38905
24-0.063832-0.49030.312868
25-0.134487-1.0330.152907
26-0.198341-1.52350.066489
27-0.135395-1.040.151295
280.0569040.43710.331823
290.1125610.86460.195381
300.1157690.88920.188742
310.0249290.19150.424402
32-0.0446-0.34260.366567
330.0822790.6320.264915
340.0758490.58260.281188
35-0.009629-0.0740.470645
360.0335340.25760.398813
370.039140.30060.382374
38-0.032513-0.24970.40183
39-0.086125-0.66150.255422
40-0.087052-0.66870.25316
41-0.019134-0.1470.441828
420.0085750.06590.473855
43-0.022338-0.17160.432176
44-0.010669-0.0820.467481
450.0029530.02270.490989
46-0.014993-0.11520.454355
470.0338450.260.397895
480.0442080.33960.367694

\begin{tabular}{lllllllll}
\hline
Autocorrelation Function \tabularnewline
Time lag k & ACF(k) & T-STAT & P-value \tabularnewline
1 & 0.367002 & 2.819 & 0.003274 \tabularnewline
2 & -0.051198 & -0.3933 & 0.347774 \tabularnewline
3 & -0.095584 & -0.7342 & 0.23287 \tabularnewline
4 & -0.022916 & -0.176 & 0.430439 \tabularnewline
5 & 0.126133 & 0.9688 & 0.168289 \tabularnewline
6 & -0.001781 & -0.0137 & 0.494566 \tabularnewline
7 & -0.153118 & -1.1761 & 0.122135 \tabularnewline
8 & -0.217053 & -1.6672 & 0.050386 \tabularnewline
9 & -0.27926 & -2.145 & 0.018039 \tabularnewline
10 & -0.194342 & -1.4928 & 0.070413 \tabularnewline
11 & 0.109532 & 0.8413 & 0.201779 \tabularnewline
12 & -0.010203 & -0.0784 & 0.468898 \tabularnewline
13 & -0.031558 & -0.2424 & 0.404655 \tabularnewline
14 & 0.101872 & 0.7825 & 0.218527 \tabularnewline
15 & 0.061245 & 0.4704 & 0.319891 \tabularnewline
16 & 0.053794 & 0.4132 & 0.340479 \tabularnewline
17 & 0.161629 & 1.2415 & 0.109667 \tabularnewline
18 & 0.240021 & 1.8436 & 0.03513 \tabularnewline
19 & 0.230534 & 1.7708 & 0.040883 \tabularnewline
20 & -0.103097 & -0.7919 & 0.215796 \tabularnewline
21 & -0.252239 & -1.9375 & 0.028739 \tabularnewline
22 & 0.010346 & 0.0795 & 0.468463 \tabularnewline
23 & 0.036855 & 0.2831 & 0.38905 \tabularnewline
24 & -0.063832 & -0.4903 & 0.312868 \tabularnewline
25 & -0.134487 & -1.033 & 0.152907 \tabularnewline
26 & -0.198341 & -1.5235 & 0.066489 \tabularnewline
27 & -0.135395 & -1.04 & 0.151295 \tabularnewline
28 & 0.056904 & 0.4371 & 0.331823 \tabularnewline
29 & 0.112561 & 0.8646 & 0.195381 \tabularnewline
30 & 0.115769 & 0.8892 & 0.188742 \tabularnewline
31 & 0.024929 & 0.1915 & 0.424402 \tabularnewline
32 & -0.0446 & -0.3426 & 0.366567 \tabularnewline
33 & 0.082279 & 0.632 & 0.264915 \tabularnewline
34 & 0.075849 & 0.5826 & 0.281188 \tabularnewline
35 & -0.009629 & -0.074 & 0.470645 \tabularnewline
36 & 0.033534 & 0.2576 & 0.398813 \tabularnewline
37 & 0.03914 & 0.3006 & 0.382374 \tabularnewline
38 & -0.032513 & -0.2497 & 0.40183 \tabularnewline
39 & -0.086125 & -0.6615 & 0.255422 \tabularnewline
40 & -0.087052 & -0.6687 & 0.25316 \tabularnewline
41 & -0.019134 & -0.147 & 0.441828 \tabularnewline
42 & 0.008575 & 0.0659 & 0.473855 \tabularnewline
43 & -0.022338 & -0.1716 & 0.432176 \tabularnewline
44 & -0.010669 & -0.082 & 0.467481 \tabularnewline
45 & 0.002953 & 0.0227 & 0.490989 \tabularnewline
46 & -0.014993 & -0.1152 & 0.454355 \tabularnewline
47 & 0.033845 & 0.26 & 0.397895 \tabularnewline
48 & 0.044208 & 0.3396 & 0.367694 \tabularnewline
\hline
\end{tabular}
%Source: https://freestatistics.org/blog/index.php?pk=143822&T=1

[TABLE]
[ROW][C]Autocorrelation Function[/C][/ROW]
[ROW][C]Time lag k[/C][C]ACF(k)[/C][C]T-STAT[/C][C]P-value[/C][/ROW]
[ROW][C]1[/C][C]0.367002[/C][C]2.819[/C][C]0.003274[/C][/ROW]
[ROW][C]2[/C][C]-0.051198[/C][C]-0.3933[/C][C]0.347774[/C][/ROW]
[ROW][C]3[/C][C]-0.095584[/C][C]-0.7342[/C][C]0.23287[/C][/ROW]
[ROW][C]4[/C][C]-0.022916[/C][C]-0.176[/C][C]0.430439[/C][/ROW]
[ROW][C]5[/C][C]0.126133[/C][C]0.9688[/C][C]0.168289[/C][/ROW]
[ROW][C]6[/C][C]-0.001781[/C][C]-0.0137[/C][C]0.494566[/C][/ROW]
[ROW][C]7[/C][C]-0.153118[/C][C]-1.1761[/C][C]0.122135[/C][/ROW]
[ROW][C]8[/C][C]-0.217053[/C][C]-1.6672[/C][C]0.050386[/C][/ROW]
[ROW][C]9[/C][C]-0.27926[/C][C]-2.145[/C][C]0.018039[/C][/ROW]
[ROW][C]10[/C][C]-0.194342[/C][C]-1.4928[/C][C]0.070413[/C][/ROW]
[ROW][C]11[/C][C]0.109532[/C][C]0.8413[/C][C]0.201779[/C][/ROW]
[ROW][C]12[/C][C]-0.010203[/C][C]-0.0784[/C][C]0.468898[/C][/ROW]
[ROW][C]13[/C][C]-0.031558[/C][C]-0.2424[/C][C]0.404655[/C][/ROW]
[ROW][C]14[/C][C]0.101872[/C][C]0.7825[/C][C]0.218527[/C][/ROW]
[ROW][C]15[/C][C]0.061245[/C][C]0.4704[/C][C]0.319891[/C][/ROW]
[ROW][C]16[/C][C]0.053794[/C][C]0.4132[/C][C]0.340479[/C][/ROW]
[ROW][C]17[/C][C]0.161629[/C][C]1.2415[/C][C]0.109667[/C][/ROW]
[ROW][C]18[/C][C]0.240021[/C][C]1.8436[/C][C]0.03513[/C][/ROW]
[ROW][C]19[/C][C]0.230534[/C][C]1.7708[/C][C]0.040883[/C][/ROW]
[ROW][C]20[/C][C]-0.103097[/C][C]-0.7919[/C][C]0.215796[/C][/ROW]
[ROW][C]21[/C][C]-0.252239[/C][C]-1.9375[/C][C]0.028739[/C][/ROW]
[ROW][C]22[/C][C]0.010346[/C][C]0.0795[/C][C]0.468463[/C][/ROW]
[ROW][C]23[/C][C]0.036855[/C][C]0.2831[/C][C]0.38905[/C][/ROW]
[ROW][C]24[/C][C]-0.063832[/C][C]-0.4903[/C][C]0.312868[/C][/ROW]
[ROW][C]25[/C][C]-0.134487[/C][C]-1.033[/C][C]0.152907[/C][/ROW]
[ROW][C]26[/C][C]-0.198341[/C][C]-1.5235[/C][C]0.066489[/C][/ROW]
[ROW][C]27[/C][C]-0.135395[/C][C]-1.04[/C][C]0.151295[/C][/ROW]
[ROW][C]28[/C][C]0.056904[/C][C]0.4371[/C][C]0.331823[/C][/ROW]
[ROW][C]29[/C][C]0.112561[/C][C]0.8646[/C][C]0.195381[/C][/ROW]
[ROW][C]30[/C][C]0.115769[/C][C]0.8892[/C][C]0.188742[/C][/ROW]
[ROW][C]31[/C][C]0.024929[/C][C]0.1915[/C][C]0.424402[/C][/ROW]
[ROW][C]32[/C][C]-0.0446[/C][C]-0.3426[/C][C]0.366567[/C][/ROW]
[ROW][C]33[/C][C]0.082279[/C][C]0.632[/C][C]0.264915[/C][/ROW]
[ROW][C]34[/C][C]0.075849[/C][C]0.5826[/C][C]0.281188[/C][/ROW]
[ROW][C]35[/C][C]-0.009629[/C][C]-0.074[/C][C]0.470645[/C][/ROW]
[ROW][C]36[/C][C]0.033534[/C][C]0.2576[/C][C]0.398813[/C][/ROW]
[ROW][C]37[/C][C]0.03914[/C][C]0.3006[/C][C]0.382374[/C][/ROW]
[ROW][C]38[/C][C]-0.032513[/C][C]-0.2497[/C][C]0.40183[/C][/ROW]
[ROW][C]39[/C][C]-0.086125[/C][C]-0.6615[/C][C]0.255422[/C][/ROW]
[ROW][C]40[/C][C]-0.087052[/C][C]-0.6687[/C][C]0.25316[/C][/ROW]
[ROW][C]41[/C][C]-0.019134[/C][C]-0.147[/C][C]0.441828[/C][/ROW]
[ROW][C]42[/C][C]0.008575[/C][C]0.0659[/C][C]0.473855[/C][/ROW]
[ROW][C]43[/C][C]-0.022338[/C][C]-0.1716[/C][C]0.432176[/C][/ROW]
[ROW][C]44[/C][C]-0.010669[/C][C]-0.082[/C][C]0.467481[/C][/ROW]
[ROW][C]45[/C][C]0.002953[/C][C]0.0227[/C][C]0.490989[/C][/ROW]
[ROW][C]46[/C][C]-0.014993[/C][C]-0.1152[/C][C]0.454355[/C][/ROW]
[ROW][C]47[/C][C]0.033845[/C][C]0.26[/C][C]0.397895[/C][/ROW]
[ROW][C]48[/C][C]0.044208[/C][C]0.3396[/C][C]0.367694[/C][/ROW]
[/TABLE]
Source: https://freestatistics.org/blog/index.php?pk=143822&T=1

Globally Unique Identifier (entire table): ba.freestatistics.org/blog/index.php?pk=143822&T=1

As an alternative you can also use a QR Code:  

The GUIDs for individual cells are displayed in the table below:

Autocorrelation Function
Time lag kACF(k)T-STATP-value
10.3670022.8190.003274
2-0.051198-0.39330.347774
3-0.095584-0.73420.23287
4-0.022916-0.1760.430439
50.1261330.96880.168289
6-0.001781-0.01370.494566
7-0.153118-1.17610.122135
8-0.217053-1.66720.050386
9-0.27926-2.1450.018039
10-0.194342-1.49280.070413
110.1095320.84130.201779
12-0.010203-0.07840.468898
13-0.031558-0.24240.404655
140.1018720.78250.218527
150.0612450.47040.319891
160.0537940.41320.340479
170.1616291.24150.109667
180.2400211.84360.03513
190.2305341.77080.040883
20-0.103097-0.79190.215796
21-0.252239-1.93750.028739
220.0103460.07950.468463
230.0368550.28310.38905
24-0.063832-0.49030.312868
25-0.134487-1.0330.152907
26-0.198341-1.52350.066489
27-0.135395-1.040.151295
280.0569040.43710.331823
290.1125610.86460.195381
300.1157690.88920.188742
310.0249290.19150.424402
32-0.0446-0.34260.366567
330.0822790.6320.264915
340.0758490.58260.281188
35-0.009629-0.0740.470645
360.0335340.25760.398813
370.039140.30060.382374
38-0.032513-0.24970.40183
39-0.086125-0.66150.255422
40-0.087052-0.66870.25316
41-0.019134-0.1470.441828
420.0085750.06590.473855
43-0.022338-0.17160.432176
44-0.010669-0.0820.467481
450.0029530.02270.490989
46-0.014993-0.11520.454355
470.0338450.260.397895
480.0442080.33960.367694


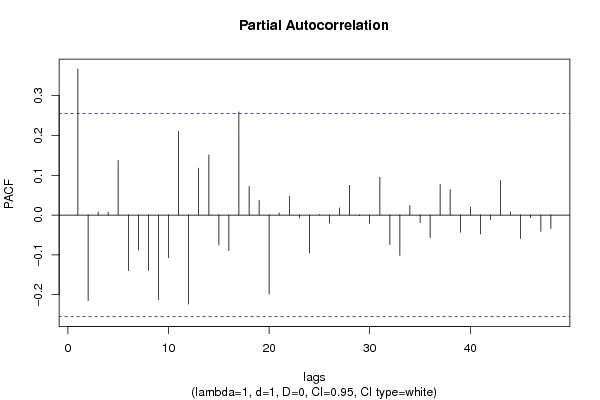
Partial Autocorrelation Function
Time lag kPACF(k)T-STATP-value
10.3670022.8190.003274
2-0.214822-1.65010.05212
30.007370.05660.477525
40.0072440.05560.477907
50.1372141.0540.148099
6-0.139492-1.07150.144163
7-0.087826-0.67460.251282
8-0.138905-1.0670.14517
9-0.212054-1.62880.05434
10-0.106863-0.82080.207524
110.2100641.61350.055983
12-0.223427-1.71620.045688
130.1178170.9050.18458
140.1512651.16190.12498
15-0.075093-0.57680.283133
16-0.089357-0.68640.247586
170.2588681.98840.025706
180.0718720.55210.291496
190.0364820.28020.390145
20-0.198774-1.52680.066076
210.005380.04130.483587
220.0468370.35980.360154
23-0.006949-0.05340.478806
24-0.095518-0.73370.233022
250.0004770.00370.498543
26-0.020068-0.15410.43901
270.0178950.13750.44557
280.0745820.57290.284452
29-0.001044-0.0080.496815
30-0.020759-0.15950.436927
310.09490.72890.234462
32-0.07393-0.56790.286139
33-0.101313-0.77820.219781
340.0239590.1840.42731
35-0.01893-0.14540.442445
36-0.056474-0.43380.333014
370.0768150.590.278713
380.064060.49210.312252
39-0.042807-0.32880.371734
400.0203750.15650.438086
41-0.04736-0.36380.358661
42-0.012028-0.09240.463351
430.0865160.66450.254465
440.0077740.05970.476293
45-0.05897-0.4530.326121
46-0.006447-0.04950.480335
47-0.041095-0.31570.376688
48-0.033833-0.25990.397933

\begin{tabular}{lllllllll}
\hline
Partial Autocorrelation Function \tabularnewline
Time lag k & PACF(k) & T-STAT & P-value \tabularnewline
1 & 0.367002 & 2.819 & 0.003274 \tabularnewline
2 & -0.214822 & -1.6501 & 0.05212 \tabularnewline
3 & 0.00737 & 0.0566 & 0.477525 \tabularnewline
4 & 0.007244 & 0.0556 & 0.477907 \tabularnewline
5 & 0.137214 & 1.054 & 0.148099 \tabularnewline
6 & -0.139492 & -1.0715 & 0.144163 \tabularnewline
7 & -0.087826 & -0.6746 & 0.251282 \tabularnewline
8 & -0.138905 & -1.067 & 0.14517 \tabularnewline
9 & -0.212054 & -1.6288 & 0.05434 \tabularnewline
10 & -0.106863 & -0.8208 & 0.207524 \tabularnewline
11 & 0.210064 & 1.6135 & 0.055983 \tabularnewline
12 & -0.223427 & -1.7162 & 0.045688 \tabularnewline
13 & 0.117817 & 0.905 & 0.18458 \tabularnewline
14 & 0.151265 & 1.1619 & 0.12498 \tabularnewline
15 & -0.075093 & -0.5768 & 0.283133 \tabularnewline
16 & -0.089357 & -0.6864 & 0.247586 \tabularnewline
17 & 0.258868 & 1.9884 & 0.025706 \tabularnewline
18 & 0.071872 & 0.5521 & 0.291496 \tabularnewline
19 & 0.036482 & 0.2802 & 0.390145 \tabularnewline
20 & -0.198774 & -1.5268 & 0.066076 \tabularnewline
21 & 0.00538 & 0.0413 & 0.483587 \tabularnewline
22 & 0.046837 & 0.3598 & 0.360154 \tabularnewline
23 & -0.006949 & -0.0534 & 0.478806 \tabularnewline
24 & -0.095518 & -0.7337 & 0.233022 \tabularnewline
25 & 0.000477 & 0.0037 & 0.498543 \tabularnewline
26 & -0.020068 & -0.1541 & 0.43901 \tabularnewline
27 & 0.017895 & 0.1375 & 0.44557 \tabularnewline
28 & 0.074582 & 0.5729 & 0.284452 \tabularnewline
29 & -0.001044 & -0.008 & 0.496815 \tabularnewline
30 & -0.020759 & -0.1595 & 0.436927 \tabularnewline
31 & 0.0949 & 0.7289 & 0.234462 \tabularnewline
32 & -0.07393 & -0.5679 & 0.286139 \tabularnewline
33 & -0.101313 & -0.7782 & 0.219781 \tabularnewline
34 & 0.023959 & 0.184 & 0.42731 \tabularnewline
35 & -0.01893 & -0.1454 & 0.442445 \tabularnewline
36 & -0.056474 & -0.4338 & 0.333014 \tabularnewline
37 & 0.076815 & 0.59 & 0.278713 \tabularnewline
38 & 0.06406 & 0.4921 & 0.312252 \tabularnewline
39 & -0.042807 & -0.3288 & 0.371734 \tabularnewline
40 & 0.020375 & 0.1565 & 0.438086 \tabularnewline
41 & -0.04736 & -0.3638 & 0.358661 \tabularnewline
42 & -0.012028 & -0.0924 & 0.463351 \tabularnewline
43 & 0.086516 & 0.6645 & 0.254465 \tabularnewline
44 & 0.007774 & 0.0597 & 0.476293 \tabularnewline
45 & -0.05897 & -0.453 & 0.326121 \tabularnewline
46 & -0.006447 & -0.0495 & 0.480335 \tabularnewline
47 & -0.041095 & -0.3157 & 0.376688 \tabularnewline
48 & -0.033833 & -0.2599 & 0.397933 \tabularnewline
\hline
\end{tabular}
%Source: https://freestatistics.org/blog/index.php?pk=143822&T=2

[TABLE]
[ROW][C]Partial Autocorrelation Function[/C][/ROW]
[ROW][C]Time lag k[/C][C]PACF(k)[/C][C]T-STAT[/C][C]P-value[/C][/ROW]
[ROW][C]1[/C][C]0.367002[/C][C]2.819[/C][C]0.003274[/C][/ROW]
[ROW][C]2[/C][C]-0.214822[/C][C]-1.6501[/C][C]0.05212[/C][/ROW]
[ROW][C]3[/C][C]0.00737[/C][C]0.0566[/C][C]0.477525[/C][/ROW]
[ROW][C]4[/C][C]0.007244[/C][C]0.0556[/C][C]0.477907[/C][/ROW]
[ROW][C]5[/C][C]0.137214[/C][C]1.054[/C][C]0.148099[/C][/ROW]
[ROW][C]6[/C][C]-0.139492[/C][C]-1.0715[/C][C]0.144163[/C][/ROW]
[ROW][C]7[/C][C]-0.087826[/C][C]-0.6746[/C][C]0.251282[/C][/ROW]
[ROW][C]8[/C][C]-0.138905[/C][C]-1.067[/C][C]0.14517[/C][/ROW]
[ROW][C]9[/C][C]-0.212054[/C][C]-1.6288[/C][C]0.05434[/C][/ROW]
[ROW][C]10[/C][C]-0.106863[/C][C]-0.8208[/C][C]0.207524[/C][/ROW]
[ROW][C]11[/C][C]0.210064[/C][C]1.6135[/C][C]0.055983[/C][/ROW]
[ROW][C]12[/C][C]-0.223427[/C][C]-1.7162[/C][C]0.045688[/C][/ROW]
[ROW][C]13[/C][C]0.117817[/C][C]0.905[/C][C]0.18458[/C][/ROW]
[ROW][C]14[/C][C]0.151265[/C][C]1.1619[/C][C]0.12498[/C][/ROW]
[ROW][C]15[/C][C]-0.075093[/C][C]-0.5768[/C][C]0.283133[/C][/ROW]
[ROW][C]16[/C][C]-0.089357[/C][C]-0.6864[/C][C]0.247586[/C][/ROW]
[ROW][C]17[/C][C]0.258868[/C][C]1.9884[/C][C]0.025706[/C][/ROW]
[ROW][C]18[/C][C]0.071872[/C][C]0.5521[/C][C]0.291496[/C][/ROW]
[ROW][C]19[/C][C]0.036482[/C][C]0.2802[/C][C]0.390145[/C][/ROW]
[ROW][C]20[/C][C]-0.198774[/C][C]-1.5268[/C][C]0.066076[/C][/ROW]
[ROW][C]21[/C][C]0.00538[/C][C]0.0413[/C][C]0.483587[/C][/ROW]
[ROW][C]22[/C][C]0.046837[/C][C]0.3598[/C][C]0.360154[/C][/ROW]
[ROW][C]23[/C][C]-0.006949[/C][C]-0.0534[/C][C]0.478806[/C][/ROW]
[ROW][C]24[/C][C]-0.095518[/C][C]-0.7337[/C][C]0.233022[/C][/ROW]
[ROW][C]25[/C][C]0.000477[/C][C]0.0037[/C][C]0.498543[/C][/ROW]
[ROW][C]26[/C][C]-0.020068[/C][C]-0.1541[/C][C]0.43901[/C][/ROW]
[ROW][C]27[/C][C]0.017895[/C][C]0.1375[/C][C]0.44557[/C][/ROW]
[ROW][C]28[/C][C]0.074582[/C][C]0.5729[/C][C]0.284452[/C][/ROW]
[ROW][C]29[/C][C]-0.001044[/C][C]-0.008[/C][C]0.496815[/C][/ROW]
[ROW][C]30[/C][C]-0.020759[/C][C]-0.1595[/C][C]0.436927[/C][/ROW]
[ROW][C]31[/C][C]0.0949[/C][C]0.7289[/C][C]0.234462[/C][/ROW]
[ROW][C]32[/C][C]-0.07393[/C][C]-0.5679[/C][C]0.286139[/C][/ROW]
[ROW][C]33[/C][C]-0.101313[/C][C]-0.7782[/C][C]0.219781[/C][/ROW]
[ROW][C]34[/C][C]0.023959[/C][C]0.184[/C][C]0.42731[/C][/ROW]
[ROW][C]35[/C][C]-0.01893[/C][C]-0.1454[/C][C]0.442445[/C][/ROW]
[ROW][C]36[/C][C]-0.056474[/C][C]-0.4338[/C][C]0.333014[/C][/ROW]
[ROW][C]37[/C][C]0.076815[/C][C]0.59[/C][C]0.278713[/C][/ROW]
[ROW][C]38[/C][C]0.06406[/C][C]0.4921[/C][C]0.312252[/C][/ROW]
[ROW][C]39[/C][C]-0.042807[/C][C]-0.3288[/C][C]0.371734[/C][/ROW]
[ROW][C]40[/C][C]0.020375[/C][C]0.1565[/C][C]0.438086[/C][/ROW]
[ROW][C]41[/C][C]-0.04736[/C][C]-0.3638[/C][C]0.358661[/C][/ROW]
[ROW][C]42[/C][C]-0.012028[/C][C]-0.0924[/C][C]0.463351[/C][/ROW]
[ROW][C]43[/C][C]0.086516[/C][C]0.6645[/C][C]0.254465[/C][/ROW]
[ROW][C]44[/C][C]0.007774[/C][C]0.0597[/C][C]0.476293[/C][/ROW]
[ROW][C]45[/C][C]-0.05897[/C][C]-0.453[/C][C]0.326121[/C][/ROW]
[ROW][C]46[/C][C]-0.006447[/C][C]-0.0495[/C][C]0.480335[/C][/ROW]
[ROW][C]47[/C][C]-0.041095[/C][C]-0.3157[/C][C]0.376688[/C][/ROW]
[ROW][C]48[/C][C]-0.033833[/C][C]-0.2599[/C][C]0.397933[/C][/ROW]
[/TABLE]
Source: https://freestatistics.org/blog/index.php?pk=143822&T=2

Globally Unique Identifier (entire table): ba.freestatistics.org/blog/index.php?pk=143822&T=2

As an alternative you can also use a QR Code:  

The GUIDs for individual cells are displayed in the table below:

Partial Autocorrelation Function
Time lag kPACF(k)T-STATP-value
10.3670022.8190.003274
2-0.214822-1.65010.05212
30.007370.05660.477525
40.0072440.05560.477907
50.1372141.0540.148099
6-0.139492-1.07150.144163
7-0.087826-0.67460.251282
8-0.138905-1.0670.14517
9-0.212054-1.62880.05434
10-0.106863-0.82080.207524
110.2100641.61350.055983
12-0.223427-1.71620.045688
130.1178170.9050.18458
140.1512651.16190.12498
15-0.075093-0.57680.283133
16-0.089357-0.68640.247586
170.2588681.98840.025706
180.0718720.55210.291496
190.0364820.28020.390145
20-0.198774-1.52680.066076
210.005380.04130.483587
220.0468370.35980.360154
23-0.006949-0.05340.478806
24-0.095518-0.73370.233022
250.0004770.00370.498543
26-0.020068-0.15410.43901
270.0178950.13750.44557
280.0745820.57290.284452
29-0.001044-0.0080.496815
30-0.020759-0.15950.436927
310.09490.72890.234462
32-0.07393-0.56790.286139
33-0.101313-0.77820.219781
340.0239590.1840.42731
35-0.01893-0.14540.442445
36-0.056474-0.43380.333014
370.0768150.590.278713
380.064060.49210.312252
39-0.042807-0.32880.371734
400.0203750.15650.438086
41-0.04736-0.36380.358661
42-0.012028-0.09240.463351
430.0865160.66450.254465
440.0077740.05970.476293
45-0.05897-0.4530.326121
46-0.006447-0.04950.480335
47-0.041095-0.31570.376688
48-0.033833-0.25990.397933


Parameters (Session):
par1 = 48 ; par2 = 1 ; par3 = 1 ; par4 = 0 ; par5 = 12 ; par6 = White Noise ; par7 = 0.95 ;
Parameters (R input):
par1 = 48 ; par2 = 1 ; par3 = 1 ; par4 = 0 ; par5 = 12 ; par6 = White Noise ; par7 = 0.95 ; par8 = ;
R code (references can be found in the software module):
if (par1 == 'Default') {
par1 = 10*log10(length(x))
} else {
par1 <- as.numeric(par1)
}
par2 <- as.numeric(par2)
par3 <- as.numeric(par3)
par4 <- as.numeric(par4)
par5 <- as.numeric(par5)
if (par6 == 'White Noise') par6 <- 'white' else par6 <- 'ma'
par7 <- as.numeric(par7)
if (par8 != '') par8 <- as.numeric(par8)
ox <- x
if (par8 == '') {
if (par2 == 0) {
x <- log(x)
} else {
x <- (x ^ par2 - 1) / par2
}
} else {
x <- log(x,base=par8)
}
if (par3 > 0) x <- diff(x,lag=1,difference=par3)
if (par4 > 0) x <- diff(x,lag=par5,difference=par4)
bitmap(file='picts.png')
op <- par(mfrow=c(2,1))
plot(ox,type='l',main='Original Time Series',xlab='time',ylab='value')
if (par8=='') {
mytitle <- paste('Working Time Series (lambda=',par2,', d=',par3,', D=',par4,')',sep='')
mysub <- paste('(lambda=',par2,', d=',par3,', D=',par4,', CI=', par7, ', CI type=',par6,')',sep='')
} else {
mytitle <- paste('Working Time Series (base=',par8,', d=',par3,', D=',par4,')',sep='')
mysub <- paste('(base=',par8,', d=',par3,', D=',par4,', CI=', par7, ', CI type=',par6,')',sep='')
}
plot(x,type='l', main=mytitle,xlab='time',ylab='value')
par(op)
dev.off()
bitmap(file='pic1.png')
racf <- acf(x, par1, main='Autocorrelation', xlab='time lag', ylab='ACF', ci.type=par6, ci=par7, sub=mysub)
dev.off()
bitmap(file='pic2.png')
rpacf <- pacf(x,par1,main='Partial Autocorrelation',xlab='lags',ylab='PACF',sub=mysub)
dev.off()
(myacf <- c(racf$acf))
(mypacf <- c(rpacf$acf))
lengthx <- length(x)
sqrtn <- sqrt(lengthx)
load(file='createtable')
a<-table.start()
a<-table.row.start(a)
a<-table.element(a,'Autocorrelation Function',4,TRUE)
a<-table.row.end(a)
a<-table.row.start(a)
a<-table.element(a,'Time lag k',header=TRUE)
a<-table.element(a,hyperlink('basics.htm','ACF(k)','click here for more information about the Autocorrelation Function'),header=TRUE)
a<-table.element(a,'T-STAT',header=TRUE)
a<-table.element(a,'P-value',header=TRUE)
a<-table.row.end(a)
for (i in 2:(par1+1)) {
a<-table.row.start(a)
a<-table.element(a,i-1,header=TRUE)
a<-table.element(a,round(myacf[i],6))
mytstat <- myacf[i]*sqrtn
a<-table.element(a,round(mytstat,4))
a<-table.element(a,round(1-pt(abs(mytstat),lengthx),6))
a<-table.row.end(a)
}
a<-table.end(a)
table.save(a,file='mytable.tab')
a<-table.start()
a<-table.row.start(a)
a<-table.element(a,'Partial Autocorrelation Function',4,TRUE)
a<-table.row.end(a)
a<-table.row.start(a)
a<-table.element(a,'Time lag k',header=TRUE)
a<-table.element(a,hyperlink('basics.htm','PACF(k)','click here for more information about the Partial Autocorrelation Function'),header=TRUE)
a<-table.element(a,'T-STAT',header=TRUE)
a<-table.element(a,'P-value',header=TRUE)
a<-table.row.end(a)
for (i in 1:par1) {
a<-table.row.start(a)
a<-table.element(a,i,header=TRUE)
a<-table.element(a,round(mypacf[i],6))
mytstat <- mypacf[i]*sqrtn
a<-table.element(a,round(mytstat,4))
a<-table.element(a,round(1-pt(abs(mytstat),lengthx),6))
a<-table.row.end(a)
}
a<-table.end(a)
table.save(a,file='mytable1.tab')