Free Statistics

of Irreproducible Research!

Author's title

Author*The author of this computation has been verified*
R Software Modulerwasp_chi_squared_tests.wasp
Title produced by softwareChi-Squared Test, McNemar Test, and Fisher Exact Test
Date of computationWed, 16 Nov 2011 03:37:02 -0500
Cite this page as followsStatistical Computations at FreeStatistics.org, Office for Research Development and Education, URL https://freestatistics.org/blog/index.php?v=date/2011/Nov/16/t13214326498ckabdz3l279mgk.htm/, Retrieved Thu, 25 Apr 2024 13:17:56 +0000
Statistical Computations at FreeStatistics.org, Office for Research Development and Education, URL https://freestatistics.org/blog/index.php?pk=143748, Retrieved Thu, 25 Apr 2024 13:17:56 +0000
QR Codes:

Original text written by user:
IsPrivate?No (this computation is public)
User-defined keywords
Estimated Impact147
Family? (F = Feedback message, R = changed R code, M = changed R Module, P = changed Parameters, D = changed Data)
-       [Chi-Squared Test, McNemar Test, and Fisher Exact Test] [] [2011-11-16 08:37:02] [ea5ba587a62f29790549e6d9c8da7af9] [Current]
-    D    [Chi-Squared Test, McNemar Test, and Fisher Exact Test] [] [2011-11-16 08:45:11] [74b1954779f2bc6b3fb275195772ea6c]
Feedback Forum

Post a new message
Dataseries X:
38	13
32	16
35	19
33	15
37	14
29	13
31	19
36	15
35	14
38	15
31	16
34	16
35	16
38	16
37	17
33	15
32	15
38	20
38	18
32	16
33	16
31	16
38	19
39	16
32	17
32	17
35	16
37	15
33	16
33	14
28	15
32	12
31	14
37	16
30	14
33	7
31	10
33	14
31	16
33	16
32	16
33	14
32	20
33	14
28	14
35	11
39	14
34	15
38	16
32	14
38	16
30	14
33	12
38	16
32	9
32	14
34	16
34	16
36	15
34	16
28	12
34	16
35	16
35	14
31	16
37	17
35	18
27	18
40	12
37	16
36	10
38	14
39	18
41	18
27	16
30	17
37	16
31	16
31	13
27	16
36	16
38	20
37	16
33	15
34	15
31	16
39	14
34	16
32	16
33	15
36	12
32	17
41	16
28	15
30	13
36	16
35	16
31	16
34	16
36	14
36	16
35	16
37	20
28	15
39	16
32	13
35	17
39	16
35	16
42	12
34	16
33	16
41	17
33	13
34	12
32	18
40	14
40	14
35	13
36	16
37	13
27	16
39	13
38	16
31	15
33	16
32	15
39	17
36	15
33	12
33	16
32	10
37	16
30	12
38	14
29	15
22	13
35	15
35	11
34	12
35	8
34	16
34	15
35	17
23	16
31	10
27	18
36	13
31	16
32	13
39	10
37	15
38	16
39	16
34	14
31	10
32	17
37	13
36	15
32	16
35	12
36	13


Summary of computational transaction
Raw Inputview raw input (R code)
Raw Outputview raw output of R engine
Computing time3 seconds
R Server'Herman Ole Andreas Wold' @ wold.wessa.net

\begin{tabular}{lllllllll}
\hline
Summary of computational transaction \tabularnewline
Raw Input & view raw input (R code)  \tabularnewline
Raw Output & view raw output of R engine  \tabularnewline
Computing time & 3 seconds \tabularnewline
R Server & 'Herman Ole Andreas Wold' @ wold.wessa.net \tabularnewline
\hline
\end{tabular}
%Source: https://freestatistics.org/blog/index.php?pk=143748&T=0

[TABLE]
[ROW][C]Summary of computational transaction[/C][/ROW]
[ROW][C]Raw Input[/C][C]view raw input (R code) [/C][/ROW]
[ROW][C]Raw Output[/C][C]view raw output of R engine [/C][/ROW]
[ROW][C]Computing time[/C][C]3 seconds[/C][/ROW]
[ROW][C]R Server[/C][C]'Herman Ole Andreas Wold' @ wold.wessa.net[/C][/ROW]
[/TABLE]
Source: https://freestatistics.org/blog/index.php?pk=143748&T=0

Globally Unique Identifier (entire table): ba.freestatistics.org/blog/index.php?pk=143748&T=0

As an alternative you can also use a QR Code:  

The GUIDs for individual cells are displayed in the table below:

Summary of computational transaction
Raw Inputview raw input (R code)
Raw Outputview raw output of R engine
Computing time3 seconds
R Server'Herman Ole Andreas Wold' @ wold.wessa.net


Tabulation of Results
Separate x Learning
7891011121314151617181920
2200000010000000
2300000000010000
2700000000030200
2800000101300000
2900000010100000
3000000112001000
3100030011180010
3200110122254101
3310000214460000
3400000201390000
3501002112162110
3600010121440000
3700000021252001
3800000012160112
3900010012041100
4000000102000000
4100000000011100
4200000100000000

\begin{tabular}{lllllllll}
\hline
Tabulation of Results \tabularnewline Separate x Learning \tabularnewline & 7 & 8 & 9 & 10 & 11 & 12 & 13 & 14 & 15 & 16 & 17 & 18 & 19 & 20 \tabularnewline 22 & 0 & 0 & 0 & 0 & 0 & 0 & 1 & 0 & 0 & 0 & 0 & 0 & 0 & 0 \tabularnewline 23 & 0 & 0 & 0 & 0 & 0 & 0 & 0 & 0 & 0 & 1 & 0 & 0 & 0 & 0 \tabularnewline 27 & 0 & 0 & 0 & 0 & 0 & 0 & 0 & 0 & 0 & 3 & 0 & 2 & 0 & 0 \tabularnewline 28 & 0 & 0 & 0 & 0 & 0 & 1 & 0 & 1 & 3 & 0 & 0 & 0 & 0 & 0 \tabularnewline 29 & 0 & 0 & 0 & 0 & 0 & 0 & 1 & 0 & 1 & 0 & 0 & 0 & 0 & 0 \tabularnewline 30 & 0 & 0 & 0 & 0 & 0 & 1 & 1 & 2 & 0 & 0 & 1 & 0 & 0 & 0 \tabularnewline 31 & 0 & 0 & 0 & 3 & 0 & 0 & 1 & 1 & 1 & 8 & 0 & 0 & 1 & 0 \tabularnewline 32 & 0 & 0 & 1 & 1 & 0 & 1 & 2 & 2 & 2 & 5 & 4 & 1 & 0 & 1 \tabularnewline 33 & 1 & 0 & 0 & 0 & 0 & 2 & 1 & 4 & 4 & 6 & 0 & 0 & 0 & 0 \tabularnewline 34 & 0 & 0 & 0 & 0 & 0 & 2 & 0 & 1 & 3 & 9 & 0 & 0 & 0 & 0 \tabularnewline 35 & 0 & 1 & 0 & 0 & 2 & 1 & 1 & 2 & 1 & 6 & 2 & 1 & 1 & 0 \tabularnewline 36 & 0 & 0 & 0 & 1 & 0 & 1 & 2 & 1 & 4 & 4 & 0 & 0 & 0 & 0 \tabularnewline 37 & 0 & 0 & 0 & 0 & 0 & 0 & 2 & 1 & 2 & 5 & 2 & 0 & 0 & 1 \tabularnewline 38 & 0 & 0 & 0 & 0 & 0 & 0 & 1 & 2 & 1 & 6 & 0 & 1 & 1 & 2 \tabularnewline 39 & 0 & 0 & 0 & 1 & 0 & 0 & 1 & 2 & 0 & 4 & 1 & 1 & 0 & 0 \tabularnewline 40 & 0 & 0 & 0 & 0 & 0 & 1 & 0 & 2 & 0 & 0 & 0 & 0 & 0 & 0 \tabularnewline 41 & 0 & 0 & 0 & 0 & 0 & 0 & 0 & 0 & 0 & 1 & 1 & 1 & 0 & 0 \tabularnewline 42 & 0 & 0 & 0 & 0 & 0 & 1 & 0 & 0 & 0 & 0 & 0 & 0 & 0 & 0 \tabularnewline \hline \end{tabular} %Source: https://freestatistics.org/blog/index.php?pk=143748&T=1

[TABLE]
[ROW]
Tabulation of Results[/C][/ROW] [ROW]Separate x Learning[/C][/ROW] [ROW][C] [/C][C]7[/C][C]8[/C][C]9[/C][C]10[/C][C]11[/C][C]12[/C][C]13[/C][C]14[/C][C]15[/C][C]16[/C][C]17[/C][C]18[/C][C]19[/C][C]20[/C][/ROW] [C]22[/C][C]0[/C][C]0[/C][C]0[/C][C]0[/C][C]0[/C][C]0[/C][C]1[/C][C]0[/C][C]0[/C][C]0[/C][C]0[/C][C]0[/C][C]0[/C][C]0[/C][/ROW] [C]23[/C][C]0[/C][C]0[/C][C]0[/C][C]0[/C][C]0[/C][C]0[/C][C]0[/C][C]0[/C][C]0[/C][C]1[/C][C]0[/C][C]0[/C][C]0[/C][C]0[/C][/ROW] [C]27[/C][C]0[/C][C]0[/C][C]0[/C][C]0[/C][C]0[/C][C]0[/C][C]0[/C][C]0[/C][C]0[/C][C]3[/C][C]0[/C][C]2[/C][C]0[/C][C]0[/C][/ROW] [C]28[/C][C]0[/C][C]0[/C][C]0[/C][C]0[/C][C]0[/C][C]1[/C][C]0[/C][C]1[/C][C]3[/C][C]0[/C][C]0[/C][C]0[/C][C]0[/C][C]0[/C][/ROW] [C]29[/C][C]0[/C][C]0[/C][C]0[/C][C]0[/C][C]0[/C][C]0[/C][C]1[/C][C]0[/C][C]1[/C][C]0[/C][C]0[/C][C]0[/C][C]0[/C][C]0[/C][/ROW] [C]30[/C][C]0[/C][C]0[/C][C]0[/C][C]0[/C][C]0[/C][C]1[/C][C]1[/C][C]2[/C][C]0[/C][C]0[/C][C]1[/C][C]0[/C][C]0[/C][C]0[/C][/ROW] [C]31[/C][C]0[/C][C]0[/C][C]0[/C][C]3[/C][C]0[/C][C]0[/C][C]1[/C][C]1[/C][C]1[/C][C]8[/C][C]0[/C][C]0[/C][C]1[/C][C]0[/C][/ROW] [C]32[/C][C]0[/C][C]0[/C][C]1[/C][C]1[/C][C]0[/C][C]1[/C][C]2[/C][C]2[/C][C]2[/C][C]5[/C][C]4[/C][C]1[/C][C]0[/C][C]1[/C][/ROW] [C]33[/C][C]1[/C][C]0[/C][C]0[/C][C]0[/C][C]0[/C][C]2[/C][C]1[/C][C]4[/C][C]4[/C][C]6[/C][C]0[/C][C]0[/C][C]0[/C][C]0[/C][/ROW] [C]34[/C][C]0[/C][C]0[/C][C]0[/C][C]0[/C][C]0[/C][C]2[/C][C]0[/C][C]1[/C][C]3[/C][C]9[/C][C]0[/C][C]0[/C][C]0[/C][C]0[/C][/ROW] [C]35[/C][C]0[/C][C]1[/C][C]0[/C][C]0[/C][C]2[/C][C]1[/C][C]1[/C][C]2[/C][C]1[/C][C]6[/C][C]2[/C][C]1[/C][C]1[/C][C]0[/C][/ROW] [C]36[/C][C]0[/C][C]0[/C][C]0[/C][C]1[/C][C]0[/C][C]1[/C][C]2[/C][C]1[/C][C]4[/C][C]4[/C][C]0[/C][C]0[/C][C]0[/C][C]0[/C][/ROW] [C]37[/C][C]0[/C][C]0[/C][C]0[/C][C]0[/C][C]0[/C][C]0[/C][C]2[/C][C]1[/C][C]2[/C][C]5[/C][C]2[/C][C]0[/C][C]0[/C][C]1[/C][/ROW] [C]38[/C][C]0[/C][C]0[/C][C]0[/C][C]0[/C][C]0[/C][C]0[/C][C]1[/C][C]2[/C][C]1[/C][C]6[/C][C]0[/C][C]1[/C][C]1[/C][C]2[/C][/ROW] [C]39[/C][C]0[/C][C]0[/C][C]0[/C][C]1[/C][C]0[/C][C]0[/C][C]1[/C][C]2[/C][C]0[/C][C]4[/C][C]1[/C][C]1[/C][C]0[/C][C]0[/C][/ROW] [C]40[/C][C]0[/C][C]0[/C][C]0[/C][C]0[/C][C]0[/C][C]1[/C][C]0[/C][C]2[/C][C]0[/C][C]0[/C][C]0[/C][C]0[/C][C]0[/C][C]0[/C][/ROW] [C]41[/C][C]0[/C][C]0[/C][C]0[/C][C]0[/C][C]0[/C][C]0[/C][C]0[/C][C]0[/C][C]0[/C][C]1[/C][C]1[/C][C]1[/C][C]0[/C][C]0[/C][/ROW] [C]42[/C][C]0[/C][C]0[/C][C]0[/C][C]0[/C][C]0[/C][C]1[/C][C]0[/C][C]0[/C][C]0[/C][C]0[/C][C]0[/C][C]0[/C][C]0[/C][C]0[/C][/ROW] [/TABLE] Source: https://freestatistics.org/blog/index.php?pk=143748&T=1

Globally Unique Identifier (entire table): ba.freestatistics.org/blog/index.php?pk=143748&T=1

As an alternative you can also use a QR Code:  

The GUIDs for individual cells are displayed in the table below:

Tabulation of Results
Separate x Learning
7891011121314151617181920
2200000010000000
2300000000010000
2700000000030200
2800000101300000
2900000010100000
3000000112001000
3100030011180010
3200110122254101
3310000214460000
3400000201390000
3501002112162110
3600010121440000
3700000021252001
3800000012160112
3900010012041100
4000000102000000
4100000000011100
4200000100000000


Tabulation of Expected Results
Separate x Learning
7891011121314151617181920
220.010.010.010.040.010.070.090.130.140.360.070.040.020.02
230.010.010.010.040.010.070.090.130.140.360.070.040.020.02
270.030.030.030.190.060.340.430.650.681.790.340.220.090.12
280.030.030.030.190.060.340.430.650.681.790.340.220.090.12
290.010.010.010.070.020.140.170.260.270.720.140.090.040.05
300.030.030.030.190.060.340.430.650.681.790.340.220.090.12
310.090.090.090.560.191.021.31.942.045.371.020.650.280.37
320.120.120.120.740.251.361.732.592.727.161.360.860.370.49
330.110.110.110.670.221.221.562.332.446.441.220.780.330.44
340.090.090.090.560.191.021.31.942.045.371.020.650.280.37
350.110.110.110.670.221.221.562.332.446.441.220.780.330.44
360.080.080.080.480.160.881.121.691.774.650.880.560.240.32
370.080.080.080.480.160.881.121.691.774.650.880.560.240.32
380.090.090.090.520.170.951.211.811.95.010.950.60.260.35
390.060.060.060.370.120.680.861.31.363.580.680.430.190.25
400.020.020.020.110.040.20.260.390.411.070.20.130.060.07
410.020.020.020.110.040.20.260.390.411.070.20.130.060.07
420.010.010.010.040.010.070.090.130.140.360.070.040.020.02

\begin{tabular}{lllllllll}
\hline
Tabulation of Expected Results \tabularnewline Separate x Learning \tabularnewline & 7 & 8 & 9 & 10 & 11 & 12 & 13 & 14 & 15 & 16 & 17 & 18 & 19 & 20 \tabularnewline 22 & 0.01 & 0.01 & 0.01 & 0.04 & 0.01 & 0.07 & 0.09 & 0.13 & 0.14 & 0.36 & 0.07 & 0.04 & 0.02 & 0.02 \tabularnewline 23 & 0.01 & 0.01 & 0.01 & 0.04 & 0.01 & 0.07 & 0.09 & 0.13 & 0.14 & 0.36 & 0.07 & 0.04 & 0.02 & 0.02 \tabularnewline 27 & 0.03 & 0.03 & 0.03 & 0.19 & 0.06 & 0.34 & 0.43 & 0.65 & 0.68 & 1.79 & 0.34 & 0.22 & 0.09 & 0.12 \tabularnewline 28 & 0.03 & 0.03 & 0.03 & 0.19 & 0.06 & 0.34 & 0.43 & 0.65 & 0.68 & 1.79 & 0.34 & 0.22 & 0.09 & 0.12 \tabularnewline 29 & 0.01 & 0.01 & 0.01 & 0.07 & 0.02 & 0.14 & 0.17 & 0.26 & 0.27 & 0.72 & 0.14 & 0.09 & 0.04 & 0.05 \tabularnewline 30 & 0.03 & 0.03 & 0.03 & 0.19 & 0.06 & 0.34 & 0.43 & 0.65 & 0.68 & 1.79 & 0.34 & 0.22 & 0.09 & 0.12 \tabularnewline 31 & 0.09 & 0.09 & 0.09 & 0.56 & 0.19 & 1.02 & 1.3 & 1.94 & 2.04 & 5.37 & 1.02 & 0.65 & 0.28 & 0.37 \tabularnewline 32 & 0.12 & 0.12 & 0.12 & 0.74 & 0.25 & 1.36 & 1.73 & 2.59 & 2.72 & 7.16 & 1.36 & 0.86 & 0.37 & 0.49 \tabularnewline 33 & 0.11 & 0.11 & 0.11 & 0.67 & 0.22 & 1.22 & 1.56 & 2.33 & 2.44 & 6.44 & 1.22 & 0.78 & 0.33 & 0.44 \tabularnewline 34 & 0.09 & 0.09 & 0.09 & 0.56 & 0.19 & 1.02 & 1.3 & 1.94 & 2.04 & 5.37 & 1.02 & 0.65 & 0.28 & 0.37 \tabularnewline 35 & 0.11 & 0.11 & 0.11 & 0.67 & 0.22 & 1.22 & 1.56 & 2.33 & 2.44 & 6.44 & 1.22 & 0.78 & 0.33 & 0.44 \tabularnewline 36 & 0.08 & 0.08 & 0.08 & 0.48 & 0.16 & 0.88 & 1.12 & 1.69 & 1.77 & 4.65 & 0.88 & 0.56 & 0.24 & 0.32 \tabularnewline 37 & 0.08 & 0.08 & 0.08 & 0.48 & 0.16 & 0.88 & 1.12 & 1.69 & 1.77 & 4.65 & 0.88 & 0.56 & 0.24 & 0.32 \tabularnewline 38 & 0.09 & 0.09 & 0.09 & 0.52 & 0.17 & 0.95 & 1.21 & 1.81 & 1.9 & 5.01 & 0.95 & 0.6 & 0.26 & 0.35 \tabularnewline 39 & 0.06 & 0.06 & 0.06 & 0.37 & 0.12 & 0.68 & 0.86 & 1.3 & 1.36 & 3.58 & 0.68 & 0.43 & 0.19 & 0.25 \tabularnewline 40 & 0.02 & 0.02 & 0.02 & 0.11 & 0.04 & 0.2 & 0.26 & 0.39 & 0.41 & 1.07 & 0.2 & 0.13 & 0.06 & 0.07 \tabularnewline 41 & 0.02 & 0.02 & 0.02 & 0.11 & 0.04 & 0.2 & 0.26 & 0.39 & 0.41 & 1.07 & 0.2 & 0.13 & 0.06 & 0.07 \tabularnewline 42 & 0.01 & 0.01 & 0.01 & 0.04 & 0.01 & 0.07 & 0.09 & 0.13 & 0.14 & 0.36 & 0.07 & 0.04 & 0.02 & 0.02 \tabularnewline \hline \end{tabular} %Source: https://freestatistics.org/blog/index.php?pk=143748&T=2

[TABLE]
[ROW]
Tabulation of Expected Results[/C][/ROW] [ROW]Separate x Learning[/C][/ROW] [ROW][C] [/C][C]7[/C][C]8[/C][C]9[/C][C]10[/C][C]11[/C][C]12[/C][C]13[/C][C]14[/C][C]15[/C][C]16[/C][C]17[/C][C]18[/C][C]19[/C][C]20[/C][/ROW] [C]22[/C][C]0.01[/C][C]0.01[/C][C]0.01[/C][C]0.04[/C][C]0.01[/C][C]0.07[/C][C]0.09[/C][C]0.13[/C][C]0.14[/C][C]0.36[/C][C]0.07[/C][C]0.04[/C][C]0.02[/C][C]0.02[/C][/ROW] [C]23[/C][C]0.01[/C][C]0.01[/C][C]0.01[/C][C]0.04[/C][C]0.01[/C][C]0.07[/C][C]0.09[/C][C]0.13[/C][C]0.14[/C][C]0.36[/C][C]0.07[/C][C]0.04[/C][C]0.02[/C][C]0.02[/C][/ROW] [C]27[/C][C]0.03[/C][C]0.03[/C][C]0.03[/C][C]0.19[/C][C]0.06[/C][C]0.34[/C][C]0.43[/C][C]0.65[/C][C]0.68[/C][C]1.79[/C][C]0.34[/C][C]0.22[/C][C]0.09[/C][C]0.12[/C][/ROW] [C]28[/C][C]0.03[/C][C]0.03[/C][C]0.03[/C][C]0.19[/C][C]0.06[/C][C]0.34[/C][C]0.43[/C][C]0.65[/C][C]0.68[/C][C]1.79[/C][C]0.34[/C][C]0.22[/C][C]0.09[/C][C]0.12[/C][/ROW] [C]29[/C][C]0.01[/C][C]0.01[/C][C]0.01[/C][C]0.07[/C][C]0.02[/C][C]0.14[/C][C]0.17[/C][C]0.26[/C][C]0.27[/C][C]0.72[/C][C]0.14[/C][C]0.09[/C][C]0.04[/C][C]0.05[/C][/ROW] [C]30[/C][C]0.03[/C][C]0.03[/C][C]0.03[/C][C]0.19[/C][C]0.06[/C][C]0.34[/C][C]0.43[/C][C]0.65[/C][C]0.68[/C][C]1.79[/C][C]0.34[/C][C]0.22[/C][C]0.09[/C][C]0.12[/C][/ROW] [C]31[/C][C]0.09[/C][C]0.09[/C][C]0.09[/C][C]0.56[/C][C]0.19[/C][C]1.02[/C][C]1.3[/C][C]1.94[/C][C]2.04[/C][C]5.37[/C][C]1.02[/C][C]0.65[/C][C]0.28[/C][C]0.37[/C][/ROW] [C]32[/C][C]0.12[/C][C]0.12[/C][C]0.12[/C][C]0.74[/C][C]0.25[/C][C]1.36[/C][C]1.73[/C][C]2.59[/C][C]2.72[/C][C]7.16[/C][C]1.36[/C][C]0.86[/C][C]0.37[/C][C]0.49[/C][/ROW] [C]33[/C][C]0.11[/C][C]0.11[/C][C]0.11[/C][C]0.67[/C][C]0.22[/C][C]1.22[/C][C]1.56[/C][C]2.33[/C][C]2.44[/C][C]6.44[/C][C]1.22[/C][C]0.78[/C][C]0.33[/C][C]0.44[/C][/ROW] [C]34[/C][C]0.09[/C][C]0.09[/C][C]0.09[/C][C]0.56[/C][C]0.19[/C][C]1.02[/C][C]1.3[/C][C]1.94[/C][C]2.04[/C][C]5.37[/C][C]1.02[/C][C]0.65[/C][C]0.28[/C][C]0.37[/C][/ROW] [C]35[/C][C]0.11[/C][C]0.11[/C][C]0.11[/C][C]0.67[/C][C]0.22[/C][C]1.22[/C][C]1.56[/C][C]2.33[/C][C]2.44[/C][C]6.44[/C][C]1.22[/C][C]0.78[/C][C]0.33[/C][C]0.44[/C][/ROW] [C]36[/C][C]0.08[/C][C]0.08[/C][C]0.08[/C][C]0.48[/C][C]0.16[/C][C]0.88[/C][C]1.12[/C][C]1.69[/C][C]1.77[/C][C]4.65[/C][C]0.88[/C][C]0.56[/C][C]0.24[/C][C]0.32[/C][/ROW] [C]37[/C][C]0.08[/C][C]0.08[/C][C]0.08[/C][C]0.48[/C][C]0.16[/C][C]0.88[/C][C]1.12[/C][C]1.69[/C][C]1.77[/C][C]4.65[/C][C]0.88[/C][C]0.56[/C][C]0.24[/C][C]0.32[/C][/ROW] [C]38[/C][C]0.09[/C][C]0.09[/C][C]0.09[/C][C]0.52[/C][C]0.17[/C][C]0.95[/C][C]1.21[/C][C]1.81[/C][C]1.9[/C][C]5.01[/C][C]0.95[/C][C]0.6[/C][C]0.26[/C][C]0.35[/C][/ROW] [C]39[/C][C]0.06[/C][C]0.06[/C][C]0.06[/C][C]0.37[/C][C]0.12[/C][C]0.68[/C][C]0.86[/C][C]1.3[/C][C]1.36[/C][C]3.58[/C][C]0.68[/C][C]0.43[/C][C]0.19[/C][C]0.25[/C][/ROW] [C]40[/C][C]0.02[/C][C]0.02[/C][C]0.02[/C][C]0.11[/C][C]0.04[/C][C]0.2[/C][C]0.26[/C][C]0.39[/C][C]0.41[/C][C]1.07[/C][C]0.2[/C][C]0.13[/C][C]0.06[/C][C]0.07[/C][/ROW] [C]41[/C][C]0.02[/C][C]0.02[/C][C]0.02[/C][C]0.11[/C][C]0.04[/C][C]0.2[/C][C]0.26[/C][C]0.39[/C][C]0.41[/C][C]1.07[/C][C]0.2[/C][C]0.13[/C][C]0.06[/C][C]0.07[/C][/ROW] [C]42[/C][C]0.01[/C][C]0.01[/C][C]0.01[/C][C]0.04[/C][C]0.01[/C][C]0.07[/C][C]0.09[/C][C]0.13[/C][C]0.14[/C][C]0.36[/C][C]0.07[/C][C]0.04[/C][C]0.02[/C][C]0.02[/C][/ROW] [/TABLE] Source: https://freestatistics.org/blog/index.php?pk=143748&T=2

Globally Unique Identifier (entire table): ba.freestatistics.org/blog/index.php?pk=143748&T=2

As an alternative you can also use a QR Code:  

The GUIDs for individual cells are displayed in the table below:

Tabulation of Expected Results
Separate x Learning
7891011121314151617181920
220.010.010.010.040.010.070.090.130.140.360.070.040.020.02
230.010.010.010.040.010.070.090.130.140.360.070.040.020.02
270.030.030.030.190.060.340.430.650.681.790.340.220.090.12
280.030.030.030.190.060.340.430.650.681.790.340.220.090.12
290.010.010.010.070.020.140.170.260.270.720.140.090.040.05
300.030.030.030.190.060.340.430.650.681.790.340.220.090.12
310.090.090.090.560.191.021.31.942.045.371.020.650.280.37
320.120.120.120.740.251.361.732.592.727.161.360.860.370.49
330.110.110.110.670.221.221.562.332.446.441.220.780.330.44
340.090.090.090.560.191.021.31.942.045.371.020.650.280.37
350.110.110.110.670.221.221.562.332.446.441.220.780.330.44
360.080.080.080.480.160.881.121.691.774.650.880.560.240.32
370.080.080.080.480.160.881.121.691.774.650.880.560.240.32
380.090.090.090.520.170.951.211.811.95.010.950.60.260.35
390.060.060.060.370.120.680.861.31.363.580.680.430.190.25
400.020.020.020.110.040.20.260.390.411.070.20.130.060.07
410.020.020.020.110.040.20.260.390.411.070.20.130.060.07
420.010.010.010.040.010.070.090.130.140.360.070.040.020.02


Statistical Results
Pearson's Chi-squared test
Pearson Chi Square Statistic210.33
Degrees of Freedom221
P value0.69

\begin{tabular}{lllllllll}
\hline
Statistical Results \tabularnewline
Pearson's Chi-squared test \tabularnewline
Pearson Chi Square Statistic & 210.33 \tabularnewline
Degrees of Freedom & 221 \tabularnewline
P value & 0.69 \tabularnewline
\hline
\end{tabular}
%Source: https://freestatistics.org/blog/index.php?pk=143748&T=3

[TABLE]
[ROW][C]Statistical Results[/C][/ROW]
[ROW][C]Pearson's Chi-squared test[/C][/ROW]
[ROW][C]Pearson Chi Square Statistic[/C][C]210.33[/C][/ROW]
[ROW][C]Degrees of Freedom[/C][C]221[/C][/ROW]
[ROW][C]P value[/C][C]0.69[/C][/ROW]
[/TABLE]
Source: https://freestatistics.org/blog/index.php?pk=143748&T=3

Globally Unique Identifier (entire table): ba.freestatistics.org/blog/index.php?pk=143748&T=3

As an alternative you can also use a QR Code:  

The GUIDs for individual cells are displayed in the table below:

Statistical Results
Pearson's Chi-squared test
Pearson Chi Square Statistic210.33
Degrees of Freedom221
P value0.69


Parameters (Session):
par1 = 1 ; par2 = 2 ; par3 = Pearson Chi-Squared ;
Parameters (R input):
par1 = 1 ; par2 = 2 ; par3 = Pearson Chi-Squared ;
R code (references can be found in the software module):
library(vcd)
cat1 <- as.numeric(par1) #
cat2<- as.numeric(par2) #
simulate.p.value=FALSE
if (par3 == 'Exact Pearson Chi-Squared by Simulation') simulate.p.value=TRUE
x <- t(x)
(z <- array(unlist(x),dim=c(length(x[,1]),length(x[1,]))))
(table1 <- table(z[,cat1],z[,cat2]))
(V1<-dimnames(y)[[1]][cat1])
(V2<-dimnames(y)[[1]][cat2])
bitmap(file='pic1.png')
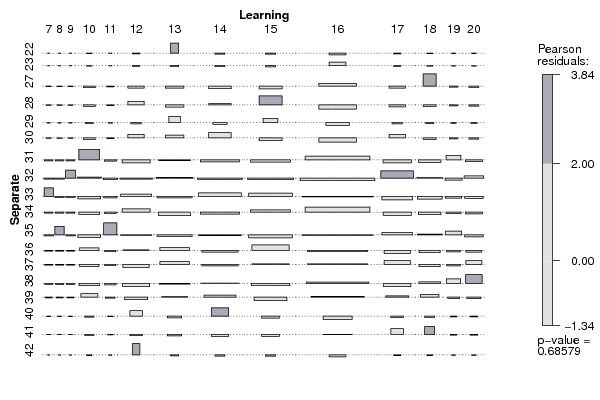
assoc(ftable(z[,cat1],z[,cat2],row.vars=1,dnn=c(V1,V2)),shade=T)
dev.off()
load(file='createtable')
a<-table.start()
a<-table.row.start(a)
a<-table.element(a,'Tabulation of Results',ncol(table1)+1,TRUE)
a<-table.row.end(a)
a<-table.row.start(a)
a<-table.element(a,paste(V1,' x ', V2),ncol(table1)+1,TRUE)
a<-table.row.end(a)
a<-table.row.start(a)
a<-table.element(a, ' ', 1,TRUE)
for(nc in 1:ncol(table1)){
a<-table.element(a, colnames(table1)[nc], 1, TRUE)
}
a<-table.row.end(a)
for(nr in 1:nrow(table1) ){
a<-table.element(a, rownames(table1)[nr], 1, TRUE)
for(nc in 1:ncol(table1) ){
a<-table.element(a, table1[nr, nc], 1, FALSE)
}
a<-table.row.end(a)
}
a<-table.end(a)
table.save(a,file='mytable.tab')
(cst<-chisq.test(table1, simulate.p.value=simulate.p.value) )
if (par3 == 'McNemar Chi-Squared') {
(cst <- mcnemar.test(table1))
}
if (par3=='Fisher Exact Test') {
(cst <- fisher.test(table1))
}
if ((par3 != 'McNemar Chi-Squared') & (par3 != 'Fisher Exact Test')) {
a<-table.start()
a<-table.row.start(a)
a<-table.element(a,'Tabulation of Expected Results',ncol(table1)+1,TRUE)
a<-table.row.end(a)
a<-table.row.start(a)
a<-table.element(a,paste(V1,' x ', V2),ncol(table1)+1,TRUE)
a<-table.row.end(a)
a<-table.row.start(a)
a<-table.element(a, ' ', 1,TRUE)
for(nc in 1:ncol(table1)){
a<-table.element(a, colnames(table1)[nc], 1, TRUE)
}
a<-table.row.end(a)
for(nr in 1:nrow(table1) ){
a<-table.element(a, rownames(table1)[nr], 1, TRUE)
for(nc in 1:ncol(table1) ){
a<-table.element(a, round(cst$expected[nr, nc], digits=2), 1, FALSE)
}
a<-table.row.end(a)
}
a<-table.end(a)
table.save(a,file='mytable1.tab')
}
a<-table.start()
a<-table.row.start(a)
a<-table.element(a,'Statistical Results',2,TRUE)
a<-table.row.end(a)
a<-table.row.start(a)
a<-table.element(a, cst$method, 2,TRUE)
a<-table.row.end(a)
a<-table.row.start(a)
if (par3=='Pearson Chi-Squared') a<-table.element(a, 'Pearson Chi Square Statistic', 1, TRUE)
if (par3=='Exact Pearson Chi-Squared by Simulation') a<-table.element(a, 'Exact Pearson Chi Square Statistic', 1, TRUE)
if (par3=='McNemar Chi-Squared') a<-table.element(a, 'McNemar Chi Square Statistic', 1, TRUE)
if (par3=='Fisher Exact Test') a<-table.element(a, 'Odds Ratio', 1, TRUE)
if (par3=='Fisher Exact Test') {
if ((ncol(table1) == 2) & (nrow(table1) == 2)) {
a<-table.element(a, round(cst$estimate, digits=2), 1,FALSE)
} else {
a<-table.element(a, '--', 1,FALSE)
}
} else {
a<-table.element(a, round(cst$statistic, digits=2), 1,FALSE)
}
a<-table.row.end(a)
if(!simulate.p.value){
if(par3!='Fisher Exact Test') {
a<-table.row.start(a)
a<-table.element(a, 'Degrees of Freedom', 1, TRUE)
a<-table.element(a, cst$parameter, 1,FALSE)
a<-table.row.end(a)
}
}
a<-table.row.start(a)
a<-table.element(a, 'P value', 1, TRUE)
a<-table.element(a, round(cst$p.value, digits=2), 1,FALSE)
a<-table.row.end(a)
a<-table.end(a)
table.save(a,file='mytable2.tab')