| Tabulation of Results | ||
| seperate x depression | ||
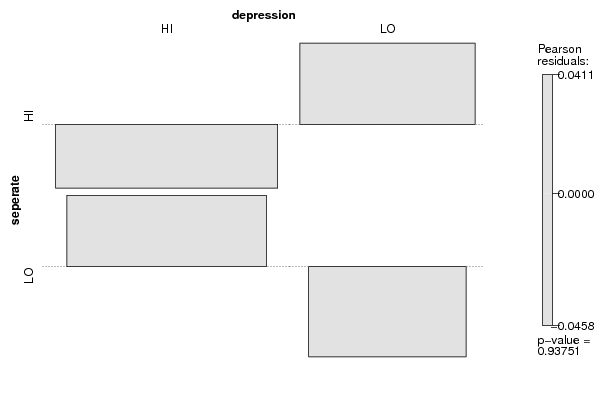
| HI | LO | HI | 54 | 34 | LO | 44 | 27 |
| Tabulation of Expected Results | ||
| seperate x depression | ||
| HI | LO | HI | 54.24 | 33.76 | LO | 43.76 | 27.24 |
| Statistical Results | |
| Pearson's Chi-squared test with Yates' continuity correction | |
| Pearson Chi Square Statistic | 0.01 |
| Degrees of Freedom | 1 |
| P value | 0.93 |