| Tabulation of Results | ||
| seperate x happiness | ||
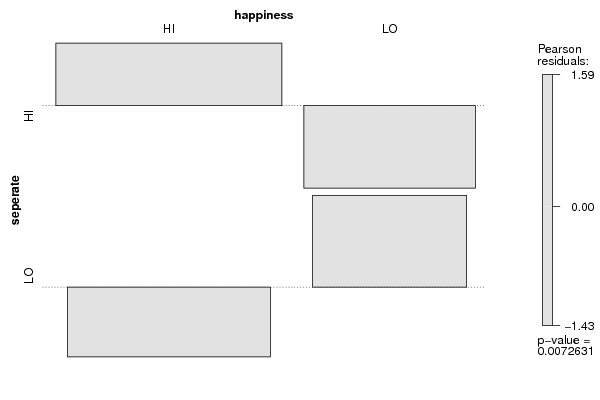
| HI | LO | HI | 64 | 24 | LO | 37 | 34 |
| Tabulation of Expected Results | ||
| seperate x happiness | ||
| HI | LO | HI | 55.9 | 32.1 | LO | 45.1 | 25.9 |
| Statistical Results | |
| Pearson's Chi-squared test with Yates' continuity correction | |
| Pearson Chi Square Statistic | 6.34 |
| Degrees of Freedom | 1 |
| P value | 0.01 |