| Tabulation of Results | ||
| connected x depression | ||
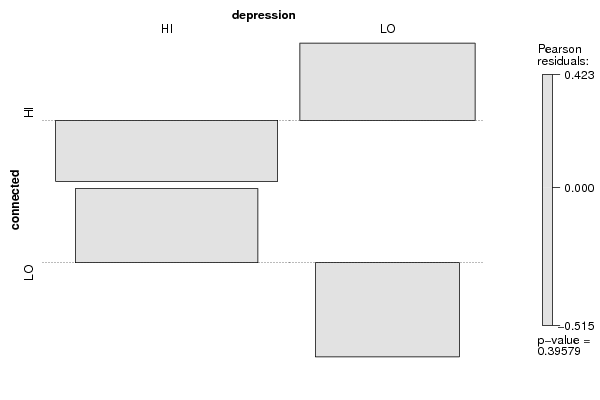
| HI | LO | HI | 56 | 39 | LO | 42 | 22 |
| Tabulation of Expected Results | ||
| connected x depression | ||
| HI | LO | HI | 58.55 | 36.45 | LO | 39.45 | 24.55 |
| Statistical Results | |
| Pearson's Chi-squared test with Yates' continuity correction | |
| Pearson Chi Square Statistic | 0.47 |
| Degrees of Freedom | 1 |
| P value | 0.49 |