| Multiple Linear Regression - Estimated Regression Equation |
| Claims[t] = -1.0636885932567 + 0.24410947353215Payments[t] + e[t] |
| Multiple Linear Regression - Ordinary Least Squares | |||||
| Variable | Parameter | S.D. | T-STAT H0: parameter = 0 | 2-tail p-value | 1-tail p-value |
| (Intercept) | -1.0636885932567 | 1.830175 | -0.5812 | 0.563251 | 0.281625 |
| Payments | 0.24410947353215 | 0.013977 | 17.4651 | 0 | 0 |
| Multiple Linear Regression - Regression Statistics | |
| Multiple R | 0.912878235023407 |
| R-squared | 0.83334667197945 |
| Adjusted R-squared | 0.830614650208621 |
| F-TEST (value) | 305.029294011327 |
| F-TEST (DF numerator) | 1 |
| F-TEST (DF denominator) | 61 |
| p-value | 0 |
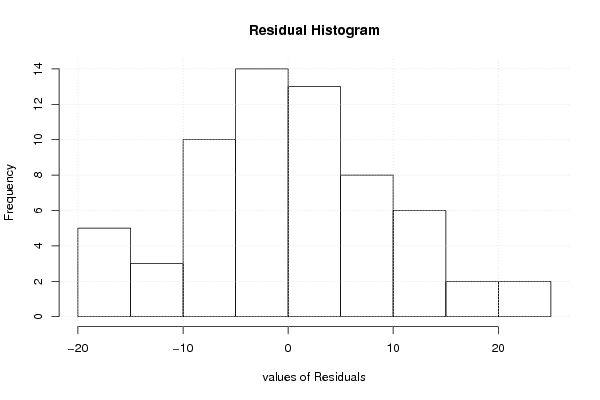
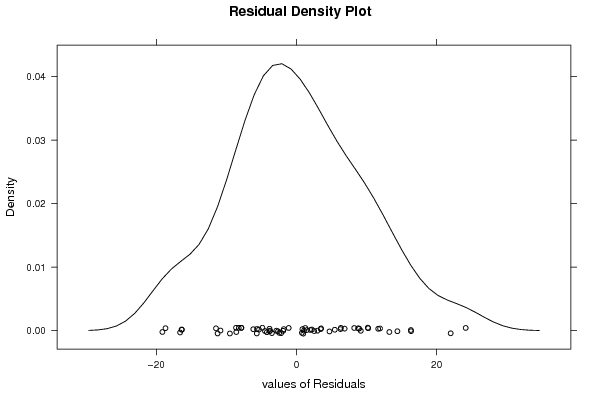
| Multiple Linear Regression - Residual Statistics | |
| Residual Standard Deviation | 9.61083216565664 |
| Sum Squared Residuals | 5634.45378990163 |
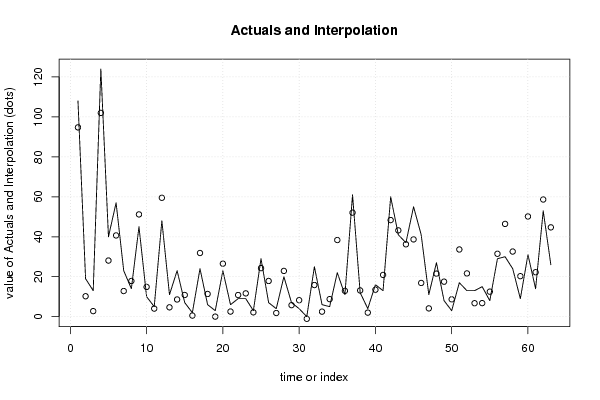
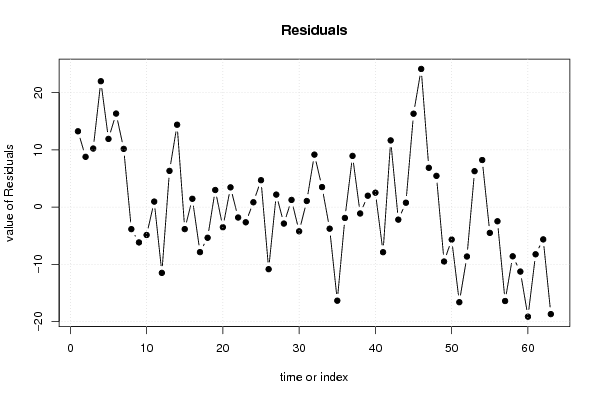
| Multiple Linear Regression - Actuals, Interpolation, and Residuals | |||
| Time or Index | Actuals | Interpolation Forecast | Residuals Prediction Error |
| 1 | 108 | 94.7492797681121 | 13.2507202318879 |
| 2 | 19 | 10.2141690839286 | 8.78583091607138 |
| 3 | 13 | 2.76883014119804 | 10.231169858802 |
| 4 | 124 | 101.999331132017 | 22.000668867983 |
| 5 | 40 | 28.082982546482 | 11.917017453518 |
| 6 | 57 | 40.6546204333877 | 16.3453795666123 |
| 7 | 23 | 12.8261404507226 | 10.1738595492774 |
| 8 | 14 | 17.8547956054849 | -3.85479560548491 |
| 9 | 45 | 51.1757387426234 | -6.17573874262336 |
| 10 | 10 | 14.8766600283927 | -4.87666002839268 |
| 11 | 5 | 4.03819940356522 | 0.961800596434777 |
| 12 | 48 | 59.4998717900697 | -11.4998717900697 |
| 13 | 11 | 4.67288403474881 | 6.32711596525119 |
| 14 | 23 | 8.60304655861643 | 14.3969534413836 |
| 15 | 7 | 10.8488537151122 | -3.8488537151122 |
| 16 | 2 | 0.547433932055485 | 1.45256606794451 |
| 17 | 24 | 31.8666793862303 | -7.86667938623031 |
| 18 | 6 | 11.3614836095297 | -5.36148360952972 |
| 19 | 3 | 0.0103930902847553 | 2.98960690971524 |
| 20 | 23 | 26.5206819158762 | -3.52068191587623 |
| 21 | 6 | 2.54913161501911 | 3.45086838498089 |
| 22 | 9 | 10.824442767759 | -1.82444276775899 |
| 23 | 9 | 11.6544149777683 | -2.6544149777683 |
| 24 | 3 | 2.15855645736767 | 0.841443542632329 |
| 25 | 29 | 24.2992857067337 | 4.70071429326634 |
| 26 | 7 | 17.8547956054849 | -10.8547956054849 |
| 27 | 4 | 1.81680319442267 | 2.18319680557733 |
| 28 | 20 | 22.8834507602472 | -2.88345076024719 |
| 29 | 7 | 5.74696571829027 | 1.25303428170973 |
| 30 | 4 | 8.2368823483182 | -4.2368823483182 |
| 31 | 0 | -1.06368859325671 | 1.06368859325671 |
| 32 | 25 | 15.8286869751681 | 9.17131302483194 |
| 33 | 6 | 2.50030972031268 | 3.49969027968732 |
| 34 | 5 | 8.77392319008893 | -3.77392319008893 |
| 35 | 22 | 38.3599913821855 | -16.3599913821855 |
| 36 | 11 | 12.8993732927823 | -1.89937329278226 |
| 37 | 61 | 52.0545328473391 | 8.94546715266091 |
| 38 | 12 | 13.1190718189612 | -1.1190718189612 |
| 39 | 4 | 2.01209077324838 | 1.98790922675162 |
| 40 | 16 | 13.4852360292594 | 2.51476397074058 |
| 41 | 13 | 20.8817530772836 | -7.88175307728357 |
| 42 | 60 | 48.3440688496504 | 11.6559311503496 |
| 43 | 41 | 43.1933589581221 | -2.19335895812206 |
| 44 | 37 | 36.2362389624558 | 0.763761037544208 |
| 45 | 55 | 38.6773336977773 | 16.3226663022227 |
| 46 | 41 | 16.8539467640031 | 24.1460532359969 |
| 47 | 11 | 4.13584319297809 | 6.86415680702191 |
| 48 | 27 | 21.5408486558204 | 5.45915134417963 |
| 49 | 8 | 17.5130423425399 | -9.5130423425399 |
| 50 | 3 | 8.67627940067607 | -5.67627940067607 |
| 51 | 17 | 33.6242675956618 | -16.6242675956618 |
| 52 | 13 | 21.6384924452332 | -8.63849244523323 |
| 53 | 13 | 6.72340361241887 | 6.27659638758113 |
| 54 | 15 | 6.7722255071253 | 8.2277744928747 |
| 55 | 8 | 12.5087981351308 | -4.50879813513082 |
| 56 | 29 | 31.4761042285789 | -2.47610422857887 |
| 57 | 30 | 46.4156040087464 | -16.4156040087464 |
| 58 | 24 | 32.5990078068268 | -8.59900780682676 |
| 59 | 9 | 20.2714793934532 | -11.2714793934532 |
| 60 | 31 | 50.1504789537883 | -19.1504789537883 |
| 61 | 14 | 22.2487661290636 | -8.2487661290636 |
| 62 | 53 | 58.6454886327071 | -5.64548863270714 |
| 63 | 26 | 44.7068376940214 | -18.7068376940214 |
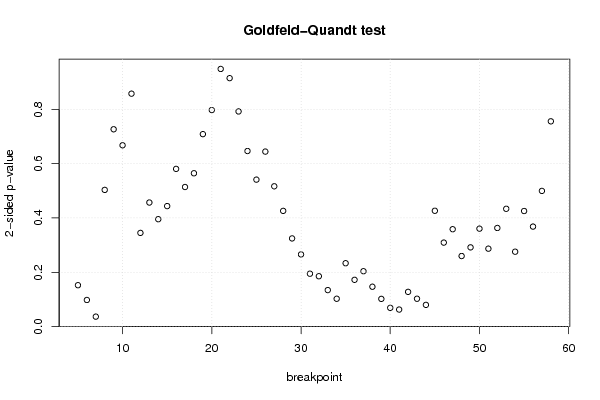
| Goldfeld-Quandt test for Heteroskedasticity | |||
| p-values | Alternative Hypothesis | ||
| breakpoint index | greater | 2-sided | less |
| 5 | 0.0761587667403584 | 0.152317533480717 | 0.923841233259642 |
| 6 | 0.048910989733892 | 0.097821979467784 | 0.951089010266108 |
| 7 | 0.0181964356568666 | 0.0363928713137333 | 0.981803564343133 |
| 8 | 0.251733558339932 | 0.503467116679864 | 0.748266441660068 |
| 9 | 0.636552606167289 | 0.726894787665421 | 0.36344739383271 |
| 10 | 0.666040431292265 | 0.667919137415471 | 0.333959568707735 |
| 11 | 0.570974838587917 | 0.858050322824166 | 0.429025161412083 |
| 12 | 0.827479093100753 | 0.345041813798495 | 0.172520906899247 |
| 13 | 0.771508889311075 | 0.456982221377851 | 0.228491110688925 |
| 14 | 0.802234427830689 | 0.395531144338622 | 0.197765572169311 |
| 15 | 0.778076586562104 | 0.443846826875792 | 0.221923413437896 |
| 16 | 0.70957428299707 | 0.58085143400586 | 0.29042571700293 |
| 17 | 0.742942057057406 | 0.514115885885187 | 0.257057942942594 |
| 18 | 0.717607500864203 | 0.564784998271594 | 0.282392499135797 |
| 19 | 0.645523548834609 | 0.708952902330782 | 0.354476451165391 |
| 20 | 0.601101840783859 | 0.797796318432281 | 0.398898159216141 |
| 21 | 0.525406529308664 | 0.949186941382672 | 0.474593470691336 |
| 22 | 0.457643886722324 | 0.915287773444648 | 0.542356113277676 |
| 23 | 0.396289769975978 | 0.792579539951956 | 0.603710230024022 |
| 24 | 0.323378690635395 | 0.64675738127079 | 0.676621309364605 |
| 25 | 0.270642558298605 | 0.54128511659721 | 0.729357441701395 |
| 26 | 0.322318800382488 | 0.644637600764977 | 0.677681199617512 |
| 27 | 0.258400141689649 | 0.516800283379298 | 0.741599858310351 |
| 28 | 0.21307020907449 | 0.42614041814898 | 0.78692979092551 |
| 29 | 0.162362637600205 | 0.324725275200409 | 0.837637362399795 |
| 30 | 0.13283212068081 | 0.26566424136162 | 0.86716787931919 |
| 31 | 0.0972757375994557 | 0.194551475198911 | 0.902724262400544 |
| 32 | 0.0926465598890616 | 0.185293119778123 | 0.907353440110938 |
| 33 | 0.0671611338833099 | 0.13432226776662 | 0.93283886611669 |
| 34 | 0.0511688963826457 | 0.102337792765291 | 0.948831103617354 |
| 35 | 0.116643919295658 | 0.233287838591316 | 0.883356080704342 |
| 36 | 0.0860552991152979 | 0.172110598230596 | 0.913944700884702 |
| 37 | 0.101890361763139 | 0.203780723526278 | 0.898109638236861 |
| 38 | 0.0733056808605956 | 0.146611361721191 | 0.926694319139404 |
| 39 | 0.0509442655895513 | 0.101888531179103 | 0.949055734410449 |
| 40 | 0.0344333895653366 | 0.0688667791306731 | 0.965566610434663 |
| 41 | 0.0312758841839737 | 0.0625517683679473 | 0.968724115816026 |
| 42 | 0.0638612171039773 | 0.127722434207955 | 0.936138782896023 |
| 43 | 0.0511872419088421 | 0.102374483817684 | 0.948812758091158 |
| 44 | 0.0398485689927745 | 0.0796971379855489 | 0.960151431007226 |
| 45 | 0.213278017516507 | 0.426556035033013 | 0.786721982483493 |
| 46 | 0.845350941513843 | 0.309298116972314 | 0.154649058486157 |
| 47 | 0.820712828629976 | 0.358574342740048 | 0.179287171370024 |
| 48 | 0.870108306200032 | 0.259783387599936 | 0.129891693799968 |
| 49 | 0.85411808490312 | 0.29176383019376 | 0.14588191509688 |
| 50 | 0.819701111919025 | 0.36059777616195 | 0.180298888080975 |
| 51 | 0.856580130823271 | 0.286839738353457 | 0.143419869176729 |
| 52 | 0.818423397206829 | 0.363153205586341 | 0.181576602793171 |
| 53 | 0.783044415175906 | 0.433911169648189 | 0.216955584824094 |
| 54 | 0.862141488237435 | 0.275717023525131 | 0.137858511762565 |
| 55 | 0.787162653940572 | 0.425674692118855 | 0.212837346059428 |
| 56 | 0.815866185344975 | 0.368267629310049 | 0.184133814655025 |
| 57 | 0.750140328834678 | 0.499719342330644 | 0.249859671165322 |
| 58 | 0.621895345791207 | 0.756209308417586 | 0.378104654208793 |
| Meta Analysis of Goldfeld-Quandt test for Heteroskedasticity | |||
| Description | # significant tests | % significant tests | OK/NOK |
| 1% type I error level | 0 | 0 | OK |
| 5% type I error level | 1 | 0.0185185185185185 | OK |
| 10% type I error level | 5 | 0.0925925925925926 | OK |