Free Statistics

of Irreproducible Research!

Author's title

Author*Unverified author*
R Software Modulerwasp_autocorrelation.wasp
Title produced by software(Partial) Autocorrelation Function
Date of computationTue, 15 Nov 2011 16:49:02 -0500
Cite this page as followsStatistical Computations at FreeStatistics.org, Office for Research Development and Education, URL https://freestatistics.org/blog/index.php?v=date/2011/Nov/15/t1321393820ocfo4yd9s91amn2.htm/, Retrieved Fri, 26 Apr 2024 05:09:56 +0000
Statistical Computations at FreeStatistics.org, Office for Research Development and Education, URL https://freestatistics.org/blog/index.php?pk=143592, Retrieved Fri, 26 Apr 2024 05:09:56 +0000
QR Codes:

Original text written by user:
IsPrivate?No (this computation is public)
User-defined keywordsKDGP2W12
Estimated Impact62
Family? (F = Feedback message, R = changed R code, M = changed R Module, P = changed Parameters, D = changed Data)
-       [(Partial) Autocorrelation Function] [aantal luchtpassa...] [2011-11-15 21:49:02] [08867764ea6bb9e6f4e56ad4eb4305bb] [Current]
Feedback Forum

Post a new message
Dataseries X:
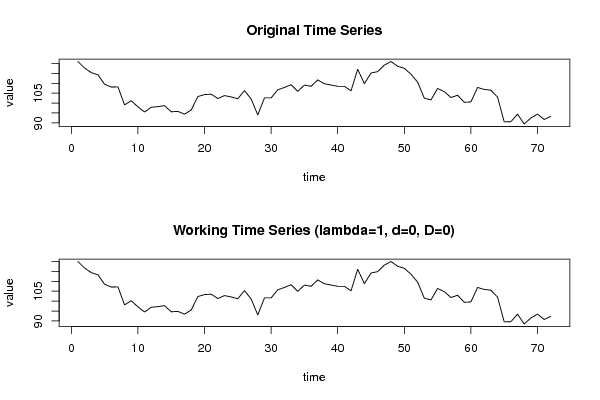
121
117,7
115,4
114,3
109,5
108,1
108,2
99,1
101,2
98,1
95,5
97,9
98,2
98,7
95,6
95,8
94,4
96,5
103,3
104,3
104,5
102,3
103,8
103,1
102,2
106,3
102,1
94
102,6
102,6
106,7
107,9
109,3
105,9
109,1
108,5
111,7
109,8
109,1
108,5
108,5
106,2
117,1
109,8
115,2
115,9
119,2
121
118,6
117,6
114,6
110,6
102,5
101,6
107,4
105,8
102,8
104
100,4
100,6
107,9
106,9
106,5
103
90,5
90,6
94,4
89,4
92,5
94,4
91,7
93,3


Summary of computational transaction
Raw Inputview raw input (R code)
Raw Outputview raw output of R engine
Computing time1 seconds
R Server'Gertrude Mary Cox' @ cox.wessa.net

\begin{tabular}{lllllllll}
\hline
Summary of computational transaction \tabularnewline
Raw Input & view raw input (R code)  \tabularnewline
Raw Output & view raw output of R engine  \tabularnewline
Computing time & 1 seconds \tabularnewline
R Server & 'Gertrude Mary Cox' @ cox.wessa.net \tabularnewline
\hline
\end{tabular}
%Source: https://freestatistics.org/blog/index.php?pk=143592&T=0

[TABLE]
[ROW][C]Summary of computational transaction[/C][/ROW]
[ROW][C]Raw Input[/C][C]view raw input (R code) [/C][/ROW]
[ROW][C]Raw Output[/C][C]view raw output of R engine [/C][/ROW]
[ROW][C]Computing time[/C][C]1 seconds[/C][/ROW]
[ROW][C]R Server[/C][C]'Gertrude Mary Cox' @ cox.wessa.net[/C][/ROW]
[/TABLE]
Source: https://freestatistics.org/blog/index.php?pk=143592&T=0

Globally Unique Identifier (entire table): ba.freestatistics.org/blog/index.php?pk=143592&T=0

As an alternative you can also use a QR Code:  

The GUIDs for individual cells are displayed in the table below:

Summary of computational transaction
Raw Inputview raw input (R code)
Raw Outputview raw output of R engine
Computing time1 seconds
R Server'Gertrude Mary Cox' @ cox.wessa.net


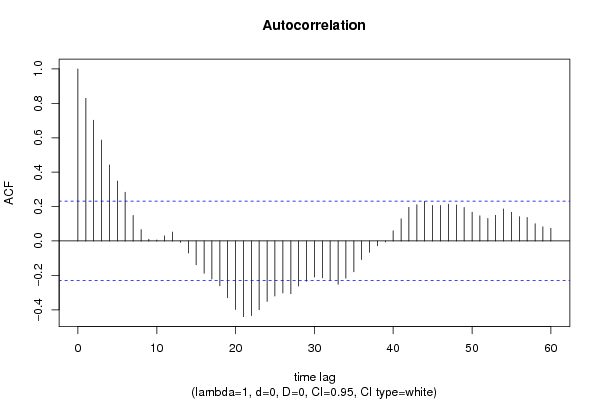
Autocorrelation Function
Time lag kACF(k)T-STATP-value
10.8289967.03430
20.7022425.95870
30.5863664.97552e-06
40.4415383.74660.000179
50.3478532.95160.002132
60.2831172.40230.009436
70.1485481.26050.105784
80.0659890.55990.288632
90.0104410.08860.464824
100.0061360.05210.479309
110.0295180.25050.401468
120.0516670.43840.3312
13-0.008279-0.07020.472096
14-0.070167-0.59540.276725
15-0.137875-1.16990.122948
16-0.188083-1.59590.057441
17-0.221073-1.87590.032364
18-0.260061-2.20670.015263
19-0.329758-2.79810.003295
20-0.397909-3.37640.000594
21-0.439862-3.73240.000188
22-0.432875-3.67310.000229
23-0.39988-3.39310.000563
24-0.351223-2.98020.001963
25-0.319465-2.71080.004194
26-0.301867-2.56140.00626
27-0.306535-2.6010.005637
28-0.262015-2.22330.014668
29-0.233382-1.98030.025745
30-0.209569-1.77830.039792
31-0.213408-1.81080.03717
32-0.22762-1.93140.028684
33-0.251536-2.13440.01811
34-0.215972-1.83260.035499
35-0.178953-1.51850.066638
36-0.107738-0.91420.181834
37-0.065509-0.55590.290014
38-0.027981-0.23740.406499
39-0.005156-0.04370.482613
400.0594160.50420.307843
410.1284161.08960.139752
420.1955231.65910.050726
430.2110971.79120.038731
440.2303031.95420.027282
450.2060331.74830.042341
460.2062391.750.04219
470.2132541.80950.037272
480.2096671.77910.039724
490.1942281.64810.051847
500.1672081.41880.080135
510.1458461.23750.109953
520.1304351.10680.136037
530.148851.2630.105325
540.1861451.57950.059304
550.1671761.41850.080175
560.1407061.19390.118212
570.1369011.16160.124609
580.0998840.84750.199751
590.0822230.69770.24381
600.074430.63160.264837

\begin{tabular}{lllllllll}
\hline
Autocorrelation Function \tabularnewline
Time lag k & ACF(k) & T-STAT & P-value \tabularnewline
1 & 0.828996 & 7.0343 & 0 \tabularnewline
2 & 0.702242 & 5.9587 & 0 \tabularnewline
3 & 0.586366 & 4.9755 & 2e-06 \tabularnewline
4 & 0.441538 & 3.7466 & 0.000179 \tabularnewline
5 & 0.347853 & 2.9516 & 0.002132 \tabularnewline
6 & 0.283117 & 2.4023 & 0.009436 \tabularnewline
7 & 0.148548 & 1.2605 & 0.105784 \tabularnewline
8 & 0.065989 & 0.5599 & 0.288632 \tabularnewline
9 & 0.010441 & 0.0886 & 0.464824 \tabularnewline
10 & 0.006136 & 0.0521 & 0.479309 \tabularnewline
11 & 0.029518 & 0.2505 & 0.401468 \tabularnewline
12 & 0.051667 & 0.4384 & 0.3312 \tabularnewline
13 & -0.008279 & -0.0702 & 0.472096 \tabularnewline
14 & -0.070167 & -0.5954 & 0.276725 \tabularnewline
15 & -0.137875 & -1.1699 & 0.122948 \tabularnewline
16 & -0.188083 & -1.5959 & 0.057441 \tabularnewline
17 & -0.221073 & -1.8759 & 0.032364 \tabularnewline
18 & -0.260061 & -2.2067 & 0.015263 \tabularnewline
19 & -0.329758 & -2.7981 & 0.003295 \tabularnewline
20 & -0.397909 & -3.3764 & 0.000594 \tabularnewline
21 & -0.439862 & -3.7324 & 0.000188 \tabularnewline
22 & -0.432875 & -3.6731 & 0.000229 \tabularnewline
23 & -0.39988 & -3.3931 & 0.000563 \tabularnewline
24 & -0.351223 & -2.9802 & 0.001963 \tabularnewline
25 & -0.319465 & -2.7108 & 0.004194 \tabularnewline
26 & -0.301867 & -2.5614 & 0.00626 \tabularnewline
27 & -0.306535 & -2.601 & 0.005637 \tabularnewline
28 & -0.262015 & -2.2233 & 0.014668 \tabularnewline
29 & -0.233382 & -1.9803 & 0.025745 \tabularnewline
30 & -0.209569 & -1.7783 & 0.039792 \tabularnewline
31 & -0.213408 & -1.8108 & 0.03717 \tabularnewline
32 & -0.22762 & -1.9314 & 0.028684 \tabularnewline
33 & -0.251536 & -2.1344 & 0.01811 \tabularnewline
34 & -0.215972 & -1.8326 & 0.035499 \tabularnewline
35 & -0.178953 & -1.5185 & 0.066638 \tabularnewline
36 & -0.107738 & -0.9142 & 0.181834 \tabularnewline
37 & -0.065509 & -0.5559 & 0.290014 \tabularnewline
38 & -0.027981 & -0.2374 & 0.406499 \tabularnewline
39 & -0.005156 & -0.0437 & 0.482613 \tabularnewline
40 & 0.059416 & 0.5042 & 0.307843 \tabularnewline
41 & 0.128416 & 1.0896 & 0.139752 \tabularnewline
42 & 0.195523 & 1.6591 & 0.050726 \tabularnewline
43 & 0.211097 & 1.7912 & 0.038731 \tabularnewline
44 & 0.230303 & 1.9542 & 0.027282 \tabularnewline
45 & 0.206033 & 1.7483 & 0.042341 \tabularnewline
46 & 0.206239 & 1.75 & 0.04219 \tabularnewline
47 & 0.213254 & 1.8095 & 0.037272 \tabularnewline
48 & 0.209667 & 1.7791 & 0.039724 \tabularnewline
49 & 0.194228 & 1.6481 & 0.051847 \tabularnewline
50 & 0.167208 & 1.4188 & 0.080135 \tabularnewline
51 & 0.145846 & 1.2375 & 0.109953 \tabularnewline
52 & 0.130435 & 1.1068 & 0.136037 \tabularnewline
53 & 0.14885 & 1.263 & 0.105325 \tabularnewline
54 & 0.186145 & 1.5795 & 0.059304 \tabularnewline
55 & 0.167176 & 1.4185 & 0.080175 \tabularnewline
56 & 0.140706 & 1.1939 & 0.118212 \tabularnewline
57 & 0.136901 & 1.1616 & 0.124609 \tabularnewline
58 & 0.099884 & 0.8475 & 0.199751 \tabularnewline
59 & 0.082223 & 0.6977 & 0.24381 \tabularnewline
60 & 0.07443 & 0.6316 & 0.264837 \tabularnewline
\hline
\end{tabular}
%Source: https://freestatistics.org/blog/index.php?pk=143592&T=1

[TABLE]
[ROW][C]Autocorrelation Function[/C][/ROW]
[ROW][C]Time lag k[/C][C]ACF(k)[/C][C]T-STAT[/C][C]P-value[/C][/ROW]
[ROW][C]1[/C][C]0.828996[/C][C]7.0343[/C][C]0[/C][/ROW]
[ROW][C]2[/C][C]0.702242[/C][C]5.9587[/C][C]0[/C][/ROW]
[ROW][C]3[/C][C]0.586366[/C][C]4.9755[/C][C]2e-06[/C][/ROW]
[ROW][C]4[/C][C]0.441538[/C][C]3.7466[/C][C]0.000179[/C][/ROW]
[ROW][C]5[/C][C]0.347853[/C][C]2.9516[/C][C]0.002132[/C][/ROW]
[ROW][C]6[/C][C]0.283117[/C][C]2.4023[/C][C]0.009436[/C][/ROW]
[ROW][C]7[/C][C]0.148548[/C][C]1.2605[/C][C]0.105784[/C][/ROW]
[ROW][C]8[/C][C]0.065989[/C][C]0.5599[/C][C]0.288632[/C][/ROW]
[ROW][C]9[/C][C]0.010441[/C][C]0.0886[/C][C]0.464824[/C][/ROW]
[ROW][C]10[/C][C]0.006136[/C][C]0.0521[/C][C]0.479309[/C][/ROW]
[ROW][C]11[/C][C]0.029518[/C][C]0.2505[/C][C]0.401468[/C][/ROW]
[ROW][C]12[/C][C]0.051667[/C][C]0.4384[/C][C]0.3312[/C][/ROW]
[ROW][C]13[/C][C]-0.008279[/C][C]-0.0702[/C][C]0.472096[/C][/ROW]
[ROW][C]14[/C][C]-0.070167[/C][C]-0.5954[/C][C]0.276725[/C][/ROW]
[ROW][C]15[/C][C]-0.137875[/C][C]-1.1699[/C][C]0.122948[/C][/ROW]
[ROW][C]16[/C][C]-0.188083[/C][C]-1.5959[/C][C]0.057441[/C][/ROW]
[ROW][C]17[/C][C]-0.221073[/C][C]-1.8759[/C][C]0.032364[/C][/ROW]
[ROW][C]18[/C][C]-0.260061[/C][C]-2.2067[/C][C]0.015263[/C][/ROW]
[ROW][C]19[/C][C]-0.329758[/C][C]-2.7981[/C][C]0.003295[/C][/ROW]
[ROW][C]20[/C][C]-0.397909[/C][C]-3.3764[/C][C]0.000594[/C][/ROW]
[ROW][C]21[/C][C]-0.439862[/C][C]-3.7324[/C][C]0.000188[/C][/ROW]
[ROW][C]22[/C][C]-0.432875[/C][C]-3.6731[/C][C]0.000229[/C][/ROW]
[ROW][C]23[/C][C]-0.39988[/C][C]-3.3931[/C][C]0.000563[/C][/ROW]
[ROW][C]24[/C][C]-0.351223[/C][C]-2.9802[/C][C]0.001963[/C][/ROW]
[ROW][C]25[/C][C]-0.319465[/C][C]-2.7108[/C][C]0.004194[/C][/ROW]
[ROW][C]26[/C][C]-0.301867[/C][C]-2.5614[/C][C]0.00626[/C][/ROW]
[ROW][C]27[/C][C]-0.306535[/C][C]-2.601[/C][C]0.005637[/C][/ROW]
[ROW][C]28[/C][C]-0.262015[/C][C]-2.2233[/C][C]0.014668[/C][/ROW]
[ROW][C]29[/C][C]-0.233382[/C][C]-1.9803[/C][C]0.025745[/C][/ROW]
[ROW][C]30[/C][C]-0.209569[/C][C]-1.7783[/C][C]0.039792[/C][/ROW]
[ROW][C]31[/C][C]-0.213408[/C][C]-1.8108[/C][C]0.03717[/C][/ROW]
[ROW][C]32[/C][C]-0.22762[/C][C]-1.9314[/C][C]0.028684[/C][/ROW]
[ROW][C]33[/C][C]-0.251536[/C][C]-2.1344[/C][C]0.01811[/C][/ROW]
[ROW][C]34[/C][C]-0.215972[/C][C]-1.8326[/C][C]0.035499[/C][/ROW]
[ROW][C]35[/C][C]-0.178953[/C][C]-1.5185[/C][C]0.066638[/C][/ROW]
[ROW][C]36[/C][C]-0.107738[/C][C]-0.9142[/C][C]0.181834[/C][/ROW]
[ROW][C]37[/C][C]-0.065509[/C][C]-0.5559[/C][C]0.290014[/C][/ROW]
[ROW][C]38[/C][C]-0.027981[/C][C]-0.2374[/C][C]0.406499[/C][/ROW]
[ROW][C]39[/C][C]-0.005156[/C][C]-0.0437[/C][C]0.482613[/C][/ROW]
[ROW][C]40[/C][C]0.059416[/C][C]0.5042[/C][C]0.307843[/C][/ROW]
[ROW][C]41[/C][C]0.128416[/C][C]1.0896[/C][C]0.139752[/C][/ROW]
[ROW][C]42[/C][C]0.195523[/C][C]1.6591[/C][C]0.050726[/C][/ROW]
[ROW][C]43[/C][C]0.211097[/C][C]1.7912[/C][C]0.038731[/C][/ROW]
[ROW][C]44[/C][C]0.230303[/C][C]1.9542[/C][C]0.027282[/C][/ROW]
[ROW][C]45[/C][C]0.206033[/C][C]1.7483[/C][C]0.042341[/C][/ROW]
[ROW][C]46[/C][C]0.206239[/C][C]1.75[/C][C]0.04219[/C][/ROW]
[ROW][C]47[/C][C]0.213254[/C][C]1.8095[/C][C]0.037272[/C][/ROW]
[ROW][C]48[/C][C]0.209667[/C][C]1.7791[/C][C]0.039724[/C][/ROW]
[ROW][C]49[/C][C]0.194228[/C][C]1.6481[/C][C]0.051847[/C][/ROW]
[ROW][C]50[/C][C]0.167208[/C][C]1.4188[/C][C]0.080135[/C][/ROW]
[ROW][C]51[/C][C]0.145846[/C][C]1.2375[/C][C]0.109953[/C][/ROW]
[ROW][C]52[/C][C]0.130435[/C][C]1.1068[/C][C]0.136037[/C][/ROW]
[ROW][C]53[/C][C]0.14885[/C][C]1.263[/C][C]0.105325[/C][/ROW]
[ROW][C]54[/C][C]0.186145[/C][C]1.5795[/C][C]0.059304[/C][/ROW]
[ROW][C]55[/C][C]0.167176[/C][C]1.4185[/C][C]0.080175[/C][/ROW]
[ROW][C]56[/C][C]0.140706[/C][C]1.1939[/C][C]0.118212[/C][/ROW]
[ROW][C]57[/C][C]0.136901[/C][C]1.1616[/C][C]0.124609[/C][/ROW]
[ROW][C]58[/C][C]0.099884[/C][C]0.8475[/C][C]0.199751[/C][/ROW]
[ROW][C]59[/C][C]0.082223[/C][C]0.6977[/C][C]0.24381[/C][/ROW]
[ROW][C]60[/C][C]0.07443[/C][C]0.6316[/C][C]0.264837[/C][/ROW]
[/TABLE]
Source: https://freestatistics.org/blog/index.php?pk=143592&T=1

Globally Unique Identifier (entire table): ba.freestatistics.org/blog/index.php?pk=143592&T=1

As an alternative you can also use a QR Code:  

The GUIDs for individual cells are displayed in the table below:

Autocorrelation Function
Time lag kACF(k)T-STATP-value
10.8289967.03430
20.7022425.95870
30.5863664.97552e-06
40.4415383.74660.000179
50.3478532.95160.002132
60.2831172.40230.009436
70.1485481.26050.105784
80.0659890.55990.288632
90.0104410.08860.464824
100.0061360.05210.479309
110.0295180.25050.401468
120.0516670.43840.3312
13-0.008279-0.07020.472096
14-0.070167-0.59540.276725
15-0.137875-1.16990.122948
16-0.188083-1.59590.057441
17-0.221073-1.87590.032364
18-0.260061-2.20670.015263
19-0.329758-2.79810.003295
20-0.397909-3.37640.000594
21-0.439862-3.73240.000188
22-0.432875-3.67310.000229
23-0.39988-3.39310.000563
24-0.351223-2.98020.001963
25-0.319465-2.71080.004194
26-0.301867-2.56140.00626
27-0.306535-2.6010.005637
28-0.262015-2.22330.014668
29-0.233382-1.98030.025745
30-0.209569-1.77830.039792
31-0.213408-1.81080.03717
32-0.22762-1.93140.028684
33-0.251536-2.13440.01811
34-0.215972-1.83260.035499
35-0.178953-1.51850.066638
36-0.107738-0.91420.181834
37-0.065509-0.55590.290014
38-0.027981-0.23740.406499
39-0.005156-0.04370.482613
400.0594160.50420.307843
410.1284161.08960.139752
420.1955231.65910.050726
430.2110971.79120.038731
440.2303031.95420.027282
450.2060331.74830.042341
460.2062391.750.04219
470.2132541.80950.037272
480.2096671.77910.039724
490.1942281.64810.051847
500.1672081.41880.080135
510.1458461.23750.109953
520.1304351.10680.136037
530.148851.2630.105325
540.1861451.57950.059304
550.1671761.41850.080175
560.1407061.19390.118212
570.1369011.16160.124609
580.0998840.84750.199751
590.0822230.69770.24381
600.074430.63160.264837


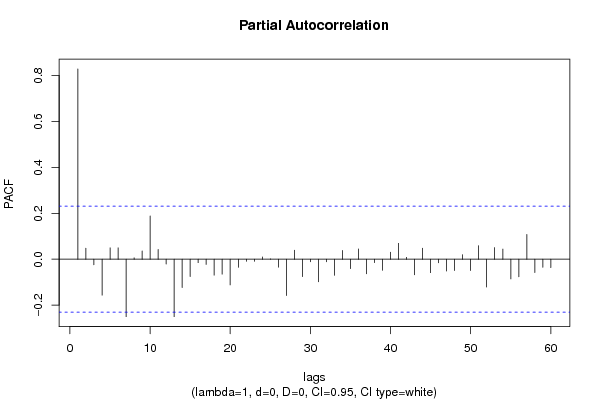
Partial Autocorrelation Function
Time lag kPACF(k)T-STATP-value
10.8289967.03430
20.0479830.40710.342553
3-0.024463-0.20760.418072
4-0.156786-1.33040.093797
50.0494650.41970.337968
60.0493390.41870.338356
7-0.250273-2.12360.018569
80.005680.04820.480847
90.0358630.30430.380885
100.1881491.59650.057379
110.0421680.35780.360769
12-0.020886-0.17720.429916
13-0.250388-2.12460.018526
14-0.123525-1.04810.149039
15-0.075294-0.63890.262462
16-0.015004-0.12730.449523
17-0.022607-0.19180.42421
18-0.069387-0.58880.27893
19-0.065013-0.55170.291446
20-0.111873-0.94930.172829
21-0.034921-0.29630.383921
22-0.009312-0.0790.468619
23-0.009201-0.07810.468992
240.0097780.0830.467052
250.0012610.01070.495748
26-0.03462-0.29380.384893
27-0.158264-1.34290.091759
280.0388860.330.371194
29-0.075879-0.64390.260858
30-0.010952-0.09290.463107
31-0.098672-0.83730.202609
32-0.011364-0.09640.461725
33-0.069867-0.59280.277574
340.038020.32260.373963
35-0.040984-0.34780.364517
360.0444210.37690.35367
37-0.063641-0.540.295426
38-0.014832-0.12590.450099
39-0.047874-0.40620.34289
400.0301240.25560.39949
410.0690790.58620.279804
420.0080040.06790.473019
43-0.06758-0.57340.28407
440.0479790.40710.342566
45-0.058587-0.49710.310306
46-0.015873-0.13470.446617
47-0.051683-0.43850.331152
48-0.048983-0.41560.339456
490.019230.16320.43542
50-0.049385-0.4190.338215
510.058860.49940.309495
52-0.121123-1.02780.153751
530.0506170.42950.334422
540.043930.37280.355211
55-0.085935-0.72920.234129
56-0.076811-0.65180.258316
570.1072840.91030.182842
58-0.057703-0.48960.312944
59-0.034852-0.29570.384143
60-0.036629-0.31080.378422

\begin{tabular}{lllllllll}
\hline
Partial Autocorrelation Function \tabularnewline
Time lag k & PACF(k) & T-STAT & P-value \tabularnewline
1 & 0.828996 & 7.0343 & 0 \tabularnewline
2 & 0.047983 & 0.4071 & 0.342553 \tabularnewline
3 & -0.024463 & -0.2076 & 0.418072 \tabularnewline
4 & -0.156786 & -1.3304 & 0.093797 \tabularnewline
5 & 0.049465 & 0.4197 & 0.337968 \tabularnewline
6 & 0.049339 & 0.4187 & 0.338356 \tabularnewline
7 & -0.250273 & -2.1236 & 0.018569 \tabularnewline
8 & 0.00568 & 0.0482 & 0.480847 \tabularnewline
9 & 0.035863 & 0.3043 & 0.380885 \tabularnewline
10 & 0.188149 & 1.5965 & 0.057379 \tabularnewline
11 & 0.042168 & 0.3578 & 0.360769 \tabularnewline
12 & -0.020886 & -0.1772 & 0.429916 \tabularnewline
13 & -0.250388 & -2.1246 & 0.018526 \tabularnewline
14 & -0.123525 & -1.0481 & 0.149039 \tabularnewline
15 & -0.075294 & -0.6389 & 0.262462 \tabularnewline
16 & -0.015004 & -0.1273 & 0.449523 \tabularnewline
17 & -0.022607 & -0.1918 & 0.42421 \tabularnewline
18 & -0.069387 & -0.5888 & 0.27893 \tabularnewline
19 & -0.065013 & -0.5517 & 0.291446 \tabularnewline
20 & -0.111873 & -0.9493 & 0.172829 \tabularnewline
21 & -0.034921 & -0.2963 & 0.383921 \tabularnewline
22 & -0.009312 & -0.079 & 0.468619 \tabularnewline
23 & -0.009201 & -0.0781 & 0.468992 \tabularnewline
24 & 0.009778 & 0.083 & 0.467052 \tabularnewline
25 & 0.001261 & 0.0107 & 0.495748 \tabularnewline
26 & -0.03462 & -0.2938 & 0.384893 \tabularnewline
27 & -0.158264 & -1.3429 & 0.091759 \tabularnewline
28 & 0.038886 & 0.33 & 0.371194 \tabularnewline
29 & -0.075879 & -0.6439 & 0.260858 \tabularnewline
30 & -0.010952 & -0.0929 & 0.463107 \tabularnewline
31 & -0.098672 & -0.8373 & 0.202609 \tabularnewline
32 & -0.011364 & -0.0964 & 0.461725 \tabularnewline
33 & -0.069867 & -0.5928 & 0.277574 \tabularnewline
34 & 0.03802 & 0.3226 & 0.373963 \tabularnewline
35 & -0.040984 & -0.3478 & 0.364517 \tabularnewline
36 & 0.044421 & 0.3769 & 0.35367 \tabularnewline
37 & -0.063641 & -0.54 & 0.295426 \tabularnewline
38 & -0.014832 & -0.1259 & 0.450099 \tabularnewline
39 & -0.047874 & -0.4062 & 0.34289 \tabularnewline
40 & 0.030124 & 0.2556 & 0.39949 \tabularnewline
41 & 0.069079 & 0.5862 & 0.279804 \tabularnewline
42 & 0.008004 & 0.0679 & 0.473019 \tabularnewline
43 & -0.06758 & -0.5734 & 0.28407 \tabularnewline
44 & 0.047979 & 0.4071 & 0.342566 \tabularnewline
45 & -0.058587 & -0.4971 & 0.310306 \tabularnewline
46 & -0.015873 & -0.1347 & 0.446617 \tabularnewline
47 & -0.051683 & -0.4385 & 0.331152 \tabularnewline
48 & -0.048983 & -0.4156 & 0.339456 \tabularnewline
49 & 0.01923 & 0.1632 & 0.43542 \tabularnewline
50 & -0.049385 & -0.419 & 0.338215 \tabularnewline
51 & 0.05886 & 0.4994 & 0.309495 \tabularnewline
52 & -0.121123 & -1.0278 & 0.153751 \tabularnewline
53 & 0.050617 & 0.4295 & 0.334422 \tabularnewline
54 & 0.04393 & 0.3728 & 0.355211 \tabularnewline
55 & -0.085935 & -0.7292 & 0.234129 \tabularnewline
56 & -0.076811 & -0.6518 & 0.258316 \tabularnewline
57 & 0.107284 & 0.9103 & 0.182842 \tabularnewline
58 & -0.057703 & -0.4896 & 0.312944 \tabularnewline
59 & -0.034852 & -0.2957 & 0.384143 \tabularnewline
60 & -0.036629 & -0.3108 & 0.378422 \tabularnewline
\hline
\end{tabular}
%Source: https://freestatistics.org/blog/index.php?pk=143592&T=2

[TABLE]
[ROW][C]Partial Autocorrelation Function[/C][/ROW]
[ROW][C]Time lag k[/C][C]PACF(k)[/C][C]T-STAT[/C][C]P-value[/C][/ROW]
[ROW][C]1[/C][C]0.828996[/C][C]7.0343[/C][C]0[/C][/ROW]
[ROW][C]2[/C][C]0.047983[/C][C]0.4071[/C][C]0.342553[/C][/ROW]
[ROW][C]3[/C][C]-0.024463[/C][C]-0.2076[/C][C]0.418072[/C][/ROW]
[ROW][C]4[/C][C]-0.156786[/C][C]-1.3304[/C][C]0.093797[/C][/ROW]
[ROW][C]5[/C][C]0.049465[/C][C]0.4197[/C][C]0.337968[/C][/ROW]
[ROW][C]6[/C][C]0.049339[/C][C]0.4187[/C][C]0.338356[/C][/ROW]
[ROW][C]7[/C][C]-0.250273[/C][C]-2.1236[/C][C]0.018569[/C][/ROW]
[ROW][C]8[/C][C]0.00568[/C][C]0.0482[/C][C]0.480847[/C][/ROW]
[ROW][C]9[/C][C]0.035863[/C][C]0.3043[/C][C]0.380885[/C][/ROW]
[ROW][C]10[/C][C]0.188149[/C][C]1.5965[/C][C]0.057379[/C][/ROW]
[ROW][C]11[/C][C]0.042168[/C][C]0.3578[/C][C]0.360769[/C][/ROW]
[ROW][C]12[/C][C]-0.020886[/C][C]-0.1772[/C][C]0.429916[/C][/ROW]
[ROW][C]13[/C][C]-0.250388[/C][C]-2.1246[/C][C]0.018526[/C][/ROW]
[ROW][C]14[/C][C]-0.123525[/C][C]-1.0481[/C][C]0.149039[/C][/ROW]
[ROW][C]15[/C][C]-0.075294[/C][C]-0.6389[/C][C]0.262462[/C][/ROW]
[ROW][C]16[/C][C]-0.015004[/C][C]-0.1273[/C][C]0.449523[/C][/ROW]
[ROW][C]17[/C][C]-0.022607[/C][C]-0.1918[/C][C]0.42421[/C][/ROW]
[ROW][C]18[/C][C]-0.069387[/C][C]-0.5888[/C][C]0.27893[/C][/ROW]
[ROW][C]19[/C][C]-0.065013[/C][C]-0.5517[/C][C]0.291446[/C][/ROW]
[ROW][C]20[/C][C]-0.111873[/C][C]-0.9493[/C][C]0.172829[/C][/ROW]
[ROW][C]21[/C][C]-0.034921[/C][C]-0.2963[/C][C]0.383921[/C][/ROW]
[ROW][C]22[/C][C]-0.009312[/C][C]-0.079[/C][C]0.468619[/C][/ROW]
[ROW][C]23[/C][C]-0.009201[/C][C]-0.0781[/C][C]0.468992[/C][/ROW]
[ROW][C]24[/C][C]0.009778[/C][C]0.083[/C][C]0.467052[/C][/ROW]
[ROW][C]25[/C][C]0.001261[/C][C]0.0107[/C][C]0.495748[/C][/ROW]
[ROW][C]26[/C][C]-0.03462[/C][C]-0.2938[/C][C]0.384893[/C][/ROW]
[ROW][C]27[/C][C]-0.158264[/C][C]-1.3429[/C][C]0.091759[/C][/ROW]
[ROW][C]28[/C][C]0.038886[/C][C]0.33[/C][C]0.371194[/C][/ROW]
[ROW][C]29[/C][C]-0.075879[/C][C]-0.6439[/C][C]0.260858[/C][/ROW]
[ROW][C]30[/C][C]-0.010952[/C][C]-0.0929[/C][C]0.463107[/C][/ROW]
[ROW][C]31[/C][C]-0.098672[/C][C]-0.8373[/C][C]0.202609[/C][/ROW]
[ROW][C]32[/C][C]-0.011364[/C][C]-0.0964[/C][C]0.461725[/C][/ROW]
[ROW][C]33[/C][C]-0.069867[/C][C]-0.5928[/C][C]0.277574[/C][/ROW]
[ROW][C]34[/C][C]0.03802[/C][C]0.3226[/C][C]0.373963[/C][/ROW]
[ROW][C]35[/C][C]-0.040984[/C][C]-0.3478[/C][C]0.364517[/C][/ROW]
[ROW][C]36[/C][C]0.044421[/C][C]0.3769[/C][C]0.35367[/C][/ROW]
[ROW][C]37[/C][C]-0.063641[/C][C]-0.54[/C][C]0.295426[/C][/ROW]
[ROW][C]38[/C][C]-0.014832[/C][C]-0.1259[/C][C]0.450099[/C][/ROW]
[ROW][C]39[/C][C]-0.047874[/C][C]-0.4062[/C][C]0.34289[/C][/ROW]
[ROW][C]40[/C][C]0.030124[/C][C]0.2556[/C][C]0.39949[/C][/ROW]
[ROW][C]41[/C][C]0.069079[/C][C]0.5862[/C][C]0.279804[/C][/ROW]
[ROW][C]42[/C][C]0.008004[/C][C]0.0679[/C][C]0.473019[/C][/ROW]
[ROW][C]43[/C][C]-0.06758[/C][C]-0.5734[/C][C]0.28407[/C][/ROW]
[ROW][C]44[/C][C]0.047979[/C][C]0.4071[/C][C]0.342566[/C][/ROW]
[ROW][C]45[/C][C]-0.058587[/C][C]-0.4971[/C][C]0.310306[/C][/ROW]
[ROW][C]46[/C][C]-0.015873[/C][C]-0.1347[/C][C]0.446617[/C][/ROW]
[ROW][C]47[/C][C]-0.051683[/C][C]-0.4385[/C][C]0.331152[/C][/ROW]
[ROW][C]48[/C][C]-0.048983[/C][C]-0.4156[/C][C]0.339456[/C][/ROW]
[ROW][C]49[/C][C]0.01923[/C][C]0.1632[/C][C]0.43542[/C][/ROW]
[ROW][C]50[/C][C]-0.049385[/C][C]-0.419[/C][C]0.338215[/C][/ROW]
[ROW][C]51[/C][C]0.05886[/C][C]0.4994[/C][C]0.309495[/C][/ROW]
[ROW][C]52[/C][C]-0.121123[/C][C]-1.0278[/C][C]0.153751[/C][/ROW]
[ROW][C]53[/C][C]0.050617[/C][C]0.4295[/C][C]0.334422[/C][/ROW]
[ROW][C]54[/C][C]0.04393[/C][C]0.3728[/C][C]0.355211[/C][/ROW]
[ROW][C]55[/C][C]-0.085935[/C][C]-0.7292[/C][C]0.234129[/C][/ROW]
[ROW][C]56[/C][C]-0.076811[/C][C]-0.6518[/C][C]0.258316[/C][/ROW]
[ROW][C]57[/C][C]0.107284[/C][C]0.9103[/C][C]0.182842[/C][/ROW]
[ROW][C]58[/C][C]-0.057703[/C][C]-0.4896[/C][C]0.312944[/C][/ROW]
[ROW][C]59[/C][C]-0.034852[/C][C]-0.2957[/C][C]0.384143[/C][/ROW]
[ROW][C]60[/C][C]-0.036629[/C][C]-0.3108[/C][C]0.378422[/C][/ROW]
[/TABLE]
Source: https://freestatistics.org/blog/index.php?pk=143592&T=2

Globally Unique Identifier (entire table): ba.freestatistics.org/blog/index.php?pk=143592&T=2

As an alternative you can also use a QR Code:  

The GUIDs for individual cells are displayed in the table below:

Partial Autocorrelation Function
Time lag kPACF(k)T-STATP-value
10.8289967.03430
20.0479830.40710.342553
3-0.024463-0.20760.418072
4-0.156786-1.33040.093797
50.0494650.41970.337968
60.0493390.41870.338356
7-0.250273-2.12360.018569
80.005680.04820.480847
90.0358630.30430.380885
100.1881491.59650.057379
110.0421680.35780.360769
12-0.020886-0.17720.429916
13-0.250388-2.12460.018526
14-0.123525-1.04810.149039
15-0.075294-0.63890.262462
16-0.015004-0.12730.449523
17-0.022607-0.19180.42421
18-0.069387-0.58880.27893
19-0.065013-0.55170.291446
20-0.111873-0.94930.172829
21-0.034921-0.29630.383921
22-0.009312-0.0790.468619
23-0.009201-0.07810.468992
240.0097780.0830.467052
250.0012610.01070.495748
26-0.03462-0.29380.384893
27-0.158264-1.34290.091759
280.0388860.330.371194
29-0.075879-0.64390.260858
30-0.010952-0.09290.463107
31-0.098672-0.83730.202609
32-0.011364-0.09640.461725
33-0.069867-0.59280.277574
340.038020.32260.373963
35-0.040984-0.34780.364517
360.0444210.37690.35367
37-0.063641-0.540.295426
38-0.014832-0.12590.450099
39-0.047874-0.40620.34289
400.0301240.25560.39949
410.0690790.58620.279804
420.0080040.06790.473019
43-0.06758-0.57340.28407
440.0479790.40710.342566
45-0.058587-0.49710.310306
46-0.015873-0.13470.446617
47-0.051683-0.43850.331152
48-0.048983-0.41560.339456
490.019230.16320.43542
50-0.049385-0.4190.338215
510.058860.49940.309495
52-0.121123-1.02780.153751
530.0506170.42950.334422
540.043930.37280.355211
55-0.085935-0.72920.234129
56-0.076811-0.65180.258316
570.1072840.91030.182842
58-0.057703-0.48960.312944
59-0.034852-0.29570.384143
60-0.036629-0.31080.378422


Parameters (Session):
par1 = 60 ; par2 = 1 ; par3 = 0 ; par4 = 0 ; par5 = 12 ; par6 = White Noise ; par7 = 0.95 ;
Parameters (R input):
par1 = 60 ; par2 = 1 ; par3 = 0 ; par4 = 0 ; par5 = 12 ; par6 = White Noise ; par7 = 0.95 ; par8 = ;
R code (references can be found in the software module):
if (par1 == 'Default') {
par1 = 10*log10(length(x))
} else {
par1 <- as.numeric(par1)
}
par2 <- as.numeric(par2)
par3 <- as.numeric(par3)
par4 <- as.numeric(par4)
par5 <- as.numeric(par5)
if (par6 == 'White Noise') par6 <- 'white' else par6 <- 'ma'
par7 <- as.numeric(par7)
if (par8 != '') par8 <- as.numeric(par8)
ox <- x
if (par8 == '') {
if (par2 == 0) {
x <- log(x)
} else {
x <- (x ^ par2 - 1) / par2
}
} else {
x <- log(x,base=par8)
}
if (par3 > 0) x <- diff(x,lag=1,difference=par3)
if (par4 > 0) x <- diff(x,lag=par5,difference=par4)
bitmap(file='picts.png')
op <- par(mfrow=c(2,1))
plot(ox,type='l',main='Original Time Series',xlab='time',ylab='value')
if (par8=='') {
mytitle <- paste('Working Time Series (lambda=',par2,', d=',par3,', D=',par4,')',sep='')
mysub <- paste('(lambda=',par2,', d=',par3,', D=',par4,', CI=', par7, ', CI type=',par6,')',sep='')
} else {
mytitle <- paste('Working Time Series (base=',par8,', d=',par3,', D=',par4,')',sep='')
mysub <- paste('(base=',par8,', d=',par3,', D=',par4,', CI=', par7, ', CI type=',par6,')',sep='')
}
plot(x,type='l', main=mytitle,xlab='time',ylab='value')
par(op)
dev.off()
bitmap(file='pic1.png')
racf <- acf(x, par1, main='Autocorrelation', xlab='time lag', ylab='ACF', ci.type=par6, ci=par7, sub=mysub)
dev.off()
bitmap(file='pic2.png')
rpacf <- pacf(x,par1,main='Partial Autocorrelation',xlab='lags',ylab='PACF',sub=mysub)
dev.off()
(myacf <- c(racf$acf))
(mypacf <- c(rpacf$acf))
lengthx <- length(x)
sqrtn <- sqrt(lengthx)
load(file='createtable')
a<-table.start()
a<-table.row.start(a)
a<-table.element(a,'Autocorrelation Function',4,TRUE)
a<-table.row.end(a)
a<-table.row.start(a)
a<-table.element(a,'Time lag k',header=TRUE)
a<-table.element(a,hyperlink('basics.htm','ACF(k)','click here for more information about the Autocorrelation Function'),header=TRUE)
a<-table.element(a,'T-STAT',header=TRUE)
a<-table.element(a,'P-value',header=TRUE)
a<-table.row.end(a)
for (i in 2:(par1+1)) {
a<-table.row.start(a)
a<-table.element(a,i-1,header=TRUE)
a<-table.element(a,round(myacf[i],6))
mytstat <- myacf[i]*sqrtn
a<-table.element(a,round(mytstat,4))
a<-table.element(a,round(1-pt(abs(mytstat),lengthx),6))
a<-table.row.end(a)
}
a<-table.end(a)
table.save(a,file='mytable.tab')
a<-table.start()
a<-table.row.start(a)
a<-table.element(a,'Partial Autocorrelation Function',4,TRUE)
a<-table.row.end(a)
a<-table.row.start(a)
a<-table.element(a,'Time lag k',header=TRUE)
a<-table.element(a,hyperlink('basics.htm','PACF(k)','click here for more information about the Partial Autocorrelation Function'),header=TRUE)
a<-table.element(a,'T-STAT',header=TRUE)
a<-table.element(a,'P-value',header=TRUE)
a<-table.row.end(a)
for (i in 1:par1) {
a<-table.row.start(a)
a<-table.element(a,i,header=TRUE)
a<-table.element(a,round(mypacf[i],6))
mytstat <- mypacf[i]*sqrtn
a<-table.element(a,round(mytstat,4))
a<-table.element(a,round(1-pt(abs(mytstat),lengthx),6))
a<-table.row.end(a)
}
a<-table.end(a)
table.save(a,file='mytable1.tab')