Free Statistics
of Irreproducible Research!
Description of Statistical Computation | |||||||||||||||||||||||||||||||||||||||||
|---|---|---|---|---|---|---|---|---|---|---|---|---|---|---|---|---|---|---|---|---|---|---|---|---|---|---|---|---|---|---|---|---|---|---|---|---|---|---|---|---|---|
| Author's title | |||||||||||||||||||||||||||||||||||||||||
| Author | *The author of this computation has been verified* | ||||||||||||||||||||||||||||||||||||||||
| R Software Module | rwasp_univariatedataseries.wasp | ||||||||||||||||||||||||||||||||||||||||
| Title produced by software | Univariate Data Series | ||||||||||||||||||||||||||||||||||||||||
| Date of computation | Tue, 15 Nov 2011 14:10:39 -0500 | ||||||||||||||||||||||||||||||||||||||||
| Cite this page as follows | Statistical Computations at FreeStatistics.org, Office for Research Development and Education, URL https://freestatistics.org/blog/index.php?v=date/2011/Nov/15/t1321384314gphbhsx206x3nvf.htm/, Retrieved Fri, 19 Apr 2024 20:11:34 +0000 | ||||||||||||||||||||||||||||||||||||||||
| Statistical Computations at FreeStatistics.org, Office for Research Development and Education, URL https://freestatistics.org/blog/index.php?pk=143377, Retrieved Fri, 19 Apr 2024 20:11:34 +0000 | |||||||||||||||||||||||||||||||||||||||||
| QR Codes: | |||||||||||||||||||||||||||||||||||||||||
|
| |||||||||||||||||||||||||||||||||||||||||
| Original text written by user: | |||||||||||||||||||||||||||||||||||||||||
| IsPrivate? | No (this computation is public) | ||||||||||||||||||||||||||||||||||||||||
| User-defined keywords | |||||||||||||||||||||||||||||||||||||||||
| Estimated Impact | 81 | ||||||||||||||||||||||||||||||||||||||||
Tree of Dependent Computations | |||||||||||||||||||||||||||||||||||||||||
| Family? (F = Feedback message, R = changed R code, M = changed R Module, P = changed Parameters, D = changed Data) | |||||||||||||||||||||||||||||||||||||||||
| - [Univariate Data Series] [Arabica Price in ...] [2008-01-05 23:14:31] [74be16979710d4c4e7c6647856088456] - RMPD [Univariate Data Series] [Aantal geboorten ...] [2011-11-15 19:10:39] [e7912d585babb6fa20e6bf5178c462ce] [Current] - D [Univariate Data Series] [Aantal geboorten ...] [2011-11-15 19:21:14] [379dab8110dbf77cfcc4b7951c3a599f] | |||||||||||||||||||||||||||||||||||||||||
| Feedback Forum | |||||||||||||||||||||||||||||||||||||||||
Post a new message | |||||||||||||||||||||||||||||||||||||||||
Dataset | |||||||||||||||||||||||||||||||||||||||||
| Dataseries X: | |||||||||||||||||||||||||||||||||||||||||
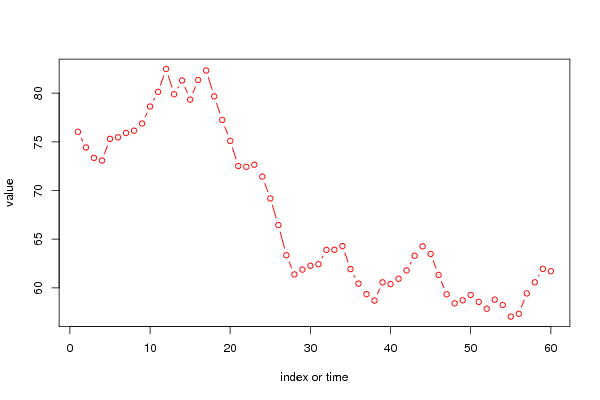
76.035 74.427 73.354 73.081 75.309 75.463 75.910 76.151 76.882 78.632 80.137 82.490 79.896 81.303 79.344 81.355 82.328 79.669 77.249 75.101 72.520 72.438 72.653 71.429 69.189 66.451 63.354 61.379 61.880 62.274 62.429 63.905 63.917 64.295 61.930 60.440 59.353 58.695 60.569 60.386 60.938 61.795 63.304 64.270 63.492 61.333 59.341 58.412 58.725 59.277 58.562 57.858 58.790 58.243 57.044 57.339 59.429 60.575 61.950 61.712 | |||||||||||||||||||||||||||||||||||||||||
Tables (Output of Computation) | |||||||||||||||||||||||||||||||||||||||||
| |||||||||||||||||||||||||||||||||||||||||
Figures (Output of Computation) | |||||||||||||||||||||||||||||||||||||||||
Input Parameters & R Code | |||||||||||||||||||||||||||||||||||||||||
| Parameters (Session): | |||||||||||||||||||||||||||||||||||||||||
| par1 = Geboorten ; par2 = Nis ; par3 = aantal geboortes in Belgi� ; par4 = No season ; | |||||||||||||||||||||||||||||||||||||||||
| Parameters (R input): | |||||||||||||||||||||||||||||||||||||||||
| par1 = Geboorten ; par2 = Nis ; par3 = aantal geboortes in Belgi� ; par4 = No season ; | |||||||||||||||||||||||||||||||||||||||||
| R code (references can be found in the software module): | |||||||||||||||||||||||||||||||||||||||||
bitmap(file='test1.png') | |||||||||||||||||||||||||||||||||||||||||