Free Statistics

of Irreproducible Research!

Author's title

Author*The author of this computation has been verified*
R Software Modulerwasp_bootstrapplot.wasp
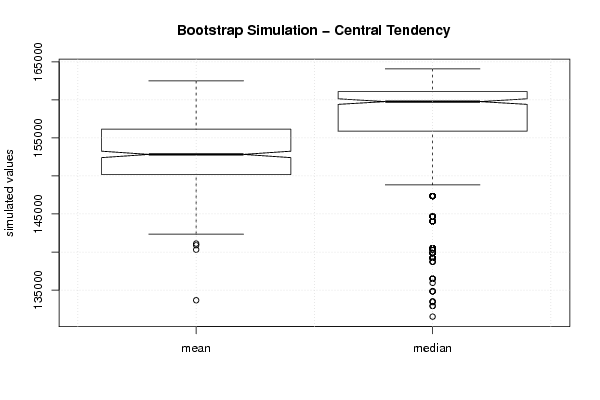
Title produced by softwareBlocked Bootstrap Plot - Central Tendency
Date of computationTue, 15 Nov 2011 11:54:29 -0500
Cite this page as followsStatistical Computations at FreeStatistics.org, Office for Research Development and Education, URL https://freestatistics.org/blog/index.php?v=date/2011/Nov/15/t1321376076qapvb46341vuh3m.htm/, Retrieved Sat, 20 Apr 2024 05:40:28 +0000
Statistical Computations at FreeStatistics.org, Office for Research Development and Education, URL https://freestatistics.org/blog/index.php?pk=143198, Retrieved Sat, 20 Apr 2024 05:40:28 +0000
QR Codes:

Original text written by user:
IsPrivate?No (this computation is public)
User-defined keywords
Estimated Impact160
Family? (F = Feedback message, R = changed R code, M = changed R Module, P = changed Parameters, D = changed Data)
-     [Bivariate Data Series] [Bivariate dataset] [2008-01-05 23:51:08] [74be16979710d4c4e7c6647856088456]
- RMPD  [Blocked Bootstrap Plot - Central Tendency] [Colombia Coffee] [2008-01-07 10:26:26] [74be16979710d4c4e7c6647856088456]
- RM D    [Blocked Bootstrap Plot - Central Tendency] [Bootstrap Car Sales] [2010-11-06 16:12:15] [97ad38b1c3b35a5feca8b85f7bc7b3ff]
-    D      [Blocked Bootstrap Plot - Central Tendency] [Blocked bootstrap...] [2010-11-06 16:42:34] [97ad38b1c3b35a5feca8b85f7bc7b3ff]
- R  D          [Blocked Bootstrap Plot - Central Tendency] [] [2011-11-15 16:54:29] [ce4468323d272130d499477f5e05a6d2] [Current]
Feedback Forum

Post a new message
Dataseries X:
127800
127700
128500
129400
128800
128800
131300
131100
131500
132900
133500
133400
134828
136488
135943
138717
139223
139869
140507
140259
139220
144033
144683
147354
148813
152657
155912
155271
161382
162106
164825
162810
163398
164844
165910
165774
164881
164861
165501
164334
162229
162748
163915
160890
159779
161106
160659
160007
158917
159052
159507
159107
159925
161327
159957
156997
159316
159793
161383
161828
162887
164071
163810
166708
168481
169913
169602
170559
170943


Summary of computational transaction
Raw Inputview raw input (R code)
Raw Outputview raw output of R engine
Computing time1 seconds
R Server'Gertrude Mary Cox' @ cox.wessa.net

\begin{tabular}{lllllllll}
\hline
Summary of computational transaction \tabularnewline
Raw Input & view raw input (R code)  \tabularnewline
Raw Output & view raw output of R engine  \tabularnewline
Computing time & 1 seconds \tabularnewline
R Server & 'Gertrude Mary Cox' @ cox.wessa.net \tabularnewline
\hline
\end{tabular}
%Source: https://freestatistics.org/blog/index.php?pk=143198&T=0

[TABLE]
[ROW][C]Summary of computational transaction[/C][/ROW]
[ROW][C]Raw Input[/C][C]view raw input (R code) [/C][/ROW]
[ROW][C]Raw Output[/C][C]view raw output of R engine [/C][/ROW]
[ROW][C]Computing time[/C][C]1 seconds[/C][/ROW]
[ROW][C]R Server[/C][C]'Gertrude Mary Cox' @ cox.wessa.net[/C][/ROW]
[/TABLE]
Source: https://freestatistics.org/blog/index.php?pk=143198&T=0

Globally Unique Identifier (entire table): ba.freestatistics.org/blog/index.php?pk=143198&T=0

As an alternative you can also use a QR Code:  

The GUIDs for individual cells are displayed in the table below:

Summary of computational transaction
Raw Inputview raw input (R code)
Raw Outputview raw output of R engine
Computing time1 seconds
R Server'Gertrude Mary Cox' @ cox.wessa.net


Estimation Results of Blocked Bootstrap
statisticQ1EstimateQ3S.D.IQR
mean150180.920289855152819.115942029156138.840579714509.840642910245957.92028985507
median1559121597791611067616.30520407895194

\begin{tabular}{lllllllll}
\hline
Estimation Results of Blocked Bootstrap \tabularnewline
statistic & Q1 & Estimate & Q3 & S.D. & IQR \tabularnewline
mean & 150180.920289855 & 152819.115942029 & 156138.84057971 & 4509.84064291024 & 5957.92028985507 \tabularnewline
median & 155912 & 159779 & 161106 & 7616.3052040789 & 5194 \tabularnewline
\hline
\end{tabular}
%Source: https://freestatistics.org/blog/index.php?pk=143198&T=1

[TABLE]
[ROW][C]Estimation Results of Blocked Bootstrap[/C][/ROW]
[ROW][C]statistic[/C][C]Q1[/C][C]Estimate[/C][C]Q3[/C][C]S.D.[/C][C]IQR[/C][/ROW]
[ROW][C]mean[/C][C]150180.920289855[/C][C]152819.115942029[/C][C]156138.84057971[/C][C]4509.84064291024[/C][C]5957.92028985507[/C][/ROW]
[ROW][C]median[/C][C]155912[/C][C]159779[/C][C]161106[/C][C]7616.3052040789[/C][C]5194[/C][/ROW]
[/TABLE]
Source: https://freestatistics.org/blog/index.php?pk=143198&T=1

Globally Unique Identifier (entire table): ba.freestatistics.org/blog/index.php?pk=143198&T=1

As an alternative you can also use a QR Code:  

The GUIDs for individual cells are displayed in the table below:

Estimation Results of Blocked Bootstrap
statisticQ1EstimateQ3S.D.IQR
mean150180.920289855152819.115942029156138.840579714509.840642910245957.92028985507
median1559121597791611067616.30520407895194


95% Confidence Intervals
MeanMedian
Lower Bound152411.121732781159411.993268426
Upper Bound153256.849281712160146.006731574

\begin{tabular}{lllllllll}
\hline
95% Confidence Intervals \tabularnewline
 & Mean & Median \tabularnewline
Lower Bound & 152411.121732781 & 159411.993268426 \tabularnewline
Upper Bound & 153256.849281712 & 160146.006731574 \tabularnewline
\hline
\end{tabular}
%Source: https://freestatistics.org/blog/index.php?pk=143198&T=2

[TABLE]
[ROW][C]95% Confidence Intervals[/C][/ROW]
[ROW][C][/C][C]Mean[/C][C]Median[/C][/ROW]
[ROW][C]Lower Bound[/C][C]152411.121732781[/C][C]159411.993268426[/C][/ROW]
[ROW][C]Upper Bound[/C][C]153256.849281712[/C][C]160146.006731574[/C][/ROW]
[/TABLE]
Source: https://freestatistics.org/blog/index.php?pk=143198&T=2

Globally Unique Identifier (entire table): ba.freestatistics.org/blog/index.php?pk=143198&T=2

As an alternative you can also use a QR Code:  

The GUIDs for individual cells are displayed in the table below:

95% Confidence Intervals
MeanMedian
Lower Bound152411.121732781159411.993268426
Upper Bound153256.849281712160146.006731574


Parameters (Session):
par1 = 500 ; par2 = 12 ;
Parameters (R input):
par1 = 500 ; par2 = 12 ;
R code (references can be found in the software module):
par1 <- as.numeric(par1)
par2 <- as.numeric(par2)
if (par1 < 10) par1 = 10
if (par1 > 5000) par1 = 5000
if (par2 < 3) par2 = 3
if (par2 > length(x)) par2 = length(x)
library(lattice)
library(boot)
boot.stat <- function(s)
{
s.mean <- mean(s)
s.median <- median(s)
c(s.mean, s.median)
}
(r <- tsboot(x, boot.stat, R=par1, l=12, sim='fixed'))
z <- data.frame(cbind(r$t[,1],r$t[,2]))
colnames(z) <- list('mean','median')
bitmap(file='plot7.png')
b <- boxplot(z,notch=TRUE,ylab='simulated values',main='Bootstrap Simulation - Central Tendency')
grid()
dev.off()
b
load(file='createtable')
a<-table.start()
a<-table.row.start(a)
a<-table.element(a,'Estimation Results of Blocked Bootstrap',6,TRUE)
a<-table.row.end(a)
a<-table.row.start(a)
a<-table.element(a,'statistic',header=TRUE)
a<-table.element(a,'Q1',header=TRUE)
a<-table.element(a,'Estimate',header=TRUE)
a<-table.element(a,'Q3',header=TRUE)
a<-table.element(a,'S.D.',header=TRUE)
a<-table.element(a,'IQR',header=TRUE)
a<-table.row.end(a)
a<-table.row.start(a)
a<-table.element(a,'mean',header=TRUE)
q1 <- quantile(r$t[,1],0.25)[[1]]
q3 <- quantile(r$t[,1],0.75)[[1]]
a<-table.element(a,q1)
a<-table.element(a,r$t0[1])
a<-table.element(a,q3)
a<-table.element(a,sqrt(var(r$t[,1])))
a<-table.element(a,q3-q1)
a<-table.row.end(a)
a<-table.row.start(a)
a<-table.element(a,'median',header=TRUE)
q1 <- quantile(r$t[,2],0.25)[[1]]
q3 <- quantile(r$t[,2],0.75)[[1]]
a<-table.element(a,q1)
a<-table.element(a,r$t0[2])
a<-table.element(a,q3)
a<-table.element(a,sqrt(var(r$t[,2])))
a<-table.element(a,q3-q1)
a<-table.row.end(a)
a<-table.end(a)
table.save(a,file='mytable.tab')

a<-table.start()
a<-table.row.start(a)
a<-table.element(a,'95% Confidence Intervals',3,TRUE)
a<-table.row.end(a)
a<-table.row.start(a)
a<-table.element(a,'',1,TRUE)
a<-table.element(a,'Mean',1,TRUE)
a<-table.element(a,'Median',1,TRUE)
a<-table.row.end(a)
a<-table.row.start(a)
a<-table.element(a,'Lower Bound',1,TRUE)
a<-table.element(a,b$conf[1,1])
a<-table.element(a,b$conf[1,2])
a<-table.row.end(a)
a<-table.row.start(a)
a<-table.element(a,'Upper Bound',1,TRUE)
a<-table.element(a,b$conf[2,1])
a<-table.element(a,b$conf[2,2])
a<-table.row.end(a)
a<-table.end(a)
table.save(a,file='mytable1.tab')