Free Statistics

of Irreproducible Research!

Author's title

Author*Unverified author*
R Software Modulerwasp_autocorrelation.wasp
Title produced by software(Partial) Autocorrelation Function
Date of computationTue, 15 Nov 2011 10:20:22 -0500
Cite this page as followsStatistical Computations at FreeStatistics.org, Office for Research Development and Education, URL https://freestatistics.org/blog/index.php?v=date/2011/Nov/15/t1321370495ln8e4l9obxjeww1.htm/, Retrieved Fri, 26 Apr 2024 18:40:52 +0000
Statistical Computations at FreeStatistics.org, Office for Research Development and Education, URL https://freestatistics.org/blog/index.php?pk=143029, Retrieved Fri, 26 Apr 2024 18:40:52 +0000
QR Codes:

Original text written by user:
IsPrivate?No (this computation is public)
User-defined keywordsKDGP2W12
Estimated Impact53
Family? (F = Feedback message, R = changed R code, M = changed R Module, P = changed Parameters, D = changed Data)
-       [(Partial) Autocorrelation Function] [] [2011-11-15 15:20:22] [30681199eb2b91d06bf445c1ee7d20a2] [Current]
Feedback Forum

Post a new message
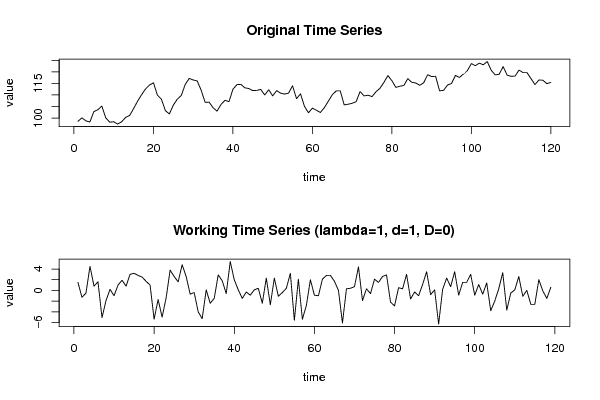
Dataseries X:
98.6
100.1
98.8
98.3
102.8
103.6
105.2
100.1
98.2
98.4
97.4
98.4
100.3
101.1
104.1
107.3
110.1
112.6
114.3
115.3
109.9
108.2
103.2
101.8
105.6
108.2
109.8
114.6
117.2
116.5
116.1
112.1
106.8
106.9
104.5
103
105.9
107.7
107.1
112.5
114.5
114.6
113.1
112.8
111.9
112
112.4
110
112.3
109.6
111.9
110.8
110.4
110.8
114
108.4
110.5
105.1
102.3
104.3
103.4
102.4
104.5
107.3
110.1
111.8
111.8
105.7
106
106.4
107.1
111.5
109.6
109.9
109.3
111.4
112.9
115.5
118.4
116.2
113.3
113.8
114.1
117.1
115.5
115.2
114.2
115.3
118.8
118
118.1
111.8
112
114.3
115
118.5
117.6
119.1
120.6
123.6
122.7
123.8
123.1
124.5
120.7
118.7
119
122.3
118.6
118.1
118.2
120.8
119.7
119.7
117.1
114.5
116.5
116.4
114.9
115.5


Summary of computational transaction
Raw Inputview raw input (R code)
Raw Outputview raw output of R engine
Computing time1 seconds
R Server'Gertrude Mary Cox' @ cox.wessa.net

\begin{tabular}{lllllllll}
\hline
Summary of computational transaction \tabularnewline
Raw Input & view raw input (R code)  \tabularnewline
Raw Output & view raw output of R engine  \tabularnewline
Computing time & 1 seconds \tabularnewline
R Server & 'Gertrude Mary Cox' @ cox.wessa.net \tabularnewline
\hline
\end{tabular}
%Source: https://freestatistics.org/blog/index.php?pk=143029&T=0

[TABLE]
[ROW][C]Summary of computational transaction[/C][/ROW]
[ROW][C]Raw Input[/C][C]view raw input (R code) [/C][/ROW]
[ROW][C]Raw Output[/C][C]view raw output of R engine [/C][/ROW]
[ROW][C]Computing time[/C][C]1 seconds[/C][/ROW]
[ROW][C]R Server[/C][C]'Gertrude Mary Cox' @ cox.wessa.net[/C][/ROW]
[/TABLE]
Source: https://freestatistics.org/blog/index.php?pk=143029&T=0

Globally Unique Identifier (entire table): ba.freestatistics.org/blog/index.php?pk=143029&T=0

As an alternative you can also use a QR Code:  

The GUIDs for individual cells are displayed in the table below:

Summary of computational transaction
Raw Inputview raw input (R code)
Raw Outputview raw output of R engine
Computing time1 seconds
R Server'Gertrude Mary Cox' @ cox.wessa.net


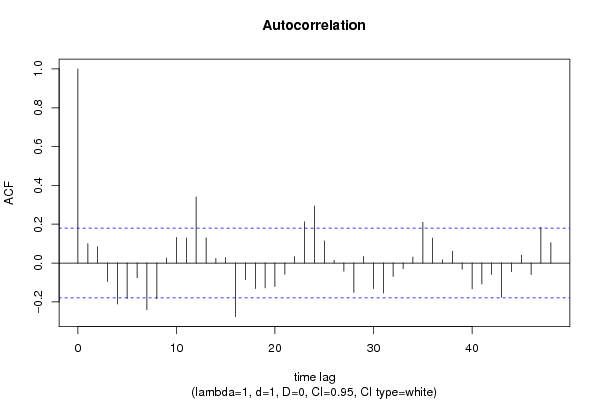
Autocorrelation Function
Time lag kACF(k)T-STATP-value
10.0998271.0890.139182
20.0843180.91980.17977
3-0.095272-1.03930.150388
4-0.211455-2.30670.0114
5-0.182368-1.98940.024475
6-0.075632-0.8250.205498
7-0.240818-2.6270.004874
8-0.183676-2.00370.023688
90.0259130.28270.388956
100.1319481.43940.076334
110.129161.4090.080726
120.339913.7080.000159
130.1298211.41620.079668
140.0233850.25510.399543
150.0268820.29320.384923
16-0.276258-3.01360.001578
17-0.085808-0.9360.175572
18-0.131398-1.43340.077186
19-0.127862-1.39480.082835
20-0.120418-1.31360.095753
21-0.057753-0.630.264946
220.0336020.36660.3573
230.212082.31350.011205
240.2931393.19780.000887
250.1140511.24420.107945
260.0138560.15120.440056
27-0.041812-0.45610.324568
28-0.151219-1.64960.050831
290.033380.36410.358203
30-0.131679-1.43640.07675
31-0.154173-1.68180.047613
32-0.068961-0.75230.226684
33-0.028877-0.3150.376654
340.0305450.33320.369782
350.2104522.29580.01172
360.1284581.40130.081862
370.0161990.17670.43002
380.0603860.65870.255669
39-0.031829-0.34720.364522
40-0.132669-1.44720.075229
41-0.108039-1.17860.120462
42-0.059215-0.6460.259775
43-0.175852-1.91830.028734
44-0.044283-0.48310.314965
450.0406340.44330.329191
46-0.058708-0.64040.261562
470.184522.01290.023193
480.1047491.14270.127734

\begin{tabular}{lllllllll}
\hline
Autocorrelation Function \tabularnewline
Time lag k & ACF(k) & T-STAT & P-value \tabularnewline
1 & 0.099827 & 1.089 & 0.139182 \tabularnewline
2 & 0.084318 & 0.9198 & 0.17977 \tabularnewline
3 & -0.095272 & -1.0393 & 0.150388 \tabularnewline
4 & -0.211455 & -2.3067 & 0.0114 \tabularnewline
5 & -0.182368 & -1.9894 & 0.024475 \tabularnewline
6 & -0.075632 & -0.825 & 0.205498 \tabularnewline
7 & -0.240818 & -2.627 & 0.004874 \tabularnewline
8 & -0.183676 & -2.0037 & 0.023688 \tabularnewline
9 & 0.025913 & 0.2827 & 0.388956 \tabularnewline
10 & 0.131948 & 1.4394 & 0.076334 \tabularnewline
11 & 0.12916 & 1.409 & 0.080726 \tabularnewline
12 & 0.33991 & 3.708 & 0.000159 \tabularnewline
13 & 0.129821 & 1.4162 & 0.079668 \tabularnewline
14 & 0.023385 & 0.2551 & 0.399543 \tabularnewline
15 & 0.026882 & 0.2932 & 0.384923 \tabularnewline
16 & -0.276258 & -3.0136 & 0.001578 \tabularnewline
17 & -0.085808 & -0.936 & 0.175572 \tabularnewline
18 & -0.131398 & -1.4334 & 0.077186 \tabularnewline
19 & -0.127862 & -1.3948 & 0.082835 \tabularnewline
20 & -0.120418 & -1.3136 & 0.095753 \tabularnewline
21 & -0.057753 & -0.63 & 0.264946 \tabularnewline
22 & 0.033602 & 0.3666 & 0.3573 \tabularnewline
23 & 0.21208 & 2.3135 & 0.011205 \tabularnewline
24 & 0.293139 & 3.1978 & 0.000887 \tabularnewline
25 & 0.114051 & 1.2442 & 0.107945 \tabularnewline
26 & 0.013856 & 0.1512 & 0.440056 \tabularnewline
27 & -0.041812 & -0.4561 & 0.324568 \tabularnewline
28 & -0.151219 & -1.6496 & 0.050831 \tabularnewline
29 & 0.03338 & 0.3641 & 0.358203 \tabularnewline
30 & -0.131679 & -1.4364 & 0.07675 \tabularnewline
31 & -0.154173 & -1.6818 & 0.047613 \tabularnewline
32 & -0.068961 & -0.7523 & 0.226684 \tabularnewline
33 & -0.028877 & -0.315 & 0.376654 \tabularnewline
34 & 0.030545 & 0.3332 & 0.369782 \tabularnewline
35 & 0.210452 & 2.2958 & 0.01172 \tabularnewline
36 & 0.128458 & 1.4013 & 0.081862 \tabularnewline
37 & 0.016199 & 0.1767 & 0.43002 \tabularnewline
38 & 0.060386 & 0.6587 & 0.255669 \tabularnewline
39 & -0.031829 & -0.3472 & 0.364522 \tabularnewline
40 & -0.132669 & -1.4472 & 0.075229 \tabularnewline
41 & -0.108039 & -1.1786 & 0.120462 \tabularnewline
42 & -0.059215 & -0.646 & 0.259775 \tabularnewline
43 & -0.175852 & -1.9183 & 0.028734 \tabularnewline
44 & -0.044283 & -0.4831 & 0.314965 \tabularnewline
45 & 0.040634 & 0.4433 & 0.329191 \tabularnewline
46 & -0.058708 & -0.6404 & 0.261562 \tabularnewline
47 & 0.18452 & 2.0129 & 0.023193 \tabularnewline
48 & 0.104749 & 1.1427 & 0.127734 \tabularnewline
\hline
\end{tabular}
%Source: https://freestatistics.org/blog/index.php?pk=143029&T=1

[TABLE]
[ROW][C]Autocorrelation Function[/C][/ROW]
[ROW][C]Time lag k[/C][C]ACF(k)[/C][C]T-STAT[/C][C]P-value[/C][/ROW]
[ROW][C]1[/C][C]0.099827[/C][C]1.089[/C][C]0.139182[/C][/ROW]
[ROW][C]2[/C][C]0.084318[/C][C]0.9198[/C][C]0.17977[/C][/ROW]
[ROW][C]3[/C][C]-0.095272[/C][C]-1.0393[/C][C]0.150388[/C][/ROW]
[ROW][C]4[/C][C]-0.211455[/C][C]-2.3067[/C][C]0.0114[/C][/ROW]
[ROW][C]5[/C][C]-0.182368[/C][C]-1.9894[/C][C]0.024475[/C][/ROW]
[ROW][C]6[/C][C]-0.075632[/C][C]-0.825[/C][C]0.205498[/C][/ROW]
[ROW][C]7[/C][C]-0.240818[/C][C]-2.627[/C][C]0.004874[/C][/ROW]
[ROW][C]8[/C][C]-0.183676[/C][C]-2.0037[/C][C]0.023688[/C][/ROW]
[ROW][C]9[/C][C]0.025913[/C][C]0.2827[/C][C]0.388956[/C][/ROW]
[ROW][C]10[/C][C]0.131948[/C][C]1.4394[/C][C]0.076334[/C][/ROW]
[ROW][C]11[/C][C]0.12916[/C][C]1.409[/C][C]0.080726[/C][/ROW]
[ROW][C]12[/C][C]0.33991[/C][C]3.708[/C][C]0.000159[/C][/ROW]
[ROW][C]13[/C][C]0.129821[/C][C]1.4162[/C][C]0.079668[/C][/ROW]
[ROW][C]14[/C][C]0.023385[/C][C]0.2551[/C][C]0.399543[/C][/ROW]
[ROW][C]15[/C][C]0.026882[/C][C]0.2932[/C][C]0.384923[/C][/ROW]
[ROW][C]16[/C][C]-0.276258[/C][C]-3.0136[/C][C]0.001578[/C][/ROW]
[ROW][C]17[/C][C]-0.085808[/C][C]-0.936[/C][C]0.175572[/C][/ROW]
[ROW][C]18[/C][C]-0.131398[/C][C]-1.4334[/C][C]0.077186[/C][/ROW]
[ROW][C]19[/C][C]-0.127862[/C][C]-1.3948[/C][C]0.082835[/C][/ROW]
[ROW][C]20[/C][C]-0.120418[/C][C]-1.3136[/C][C]0.095753[/C][/ROW]
[ROW][C]21[/C][C]-0.057753[/C][C]-0.63[/C][C]0.264946[/C][/ROW]
[ROW][C]22[/C][C]0.033602[/C][C]0.3666[/C][C]0.3573[/C][/ROW]
[ROW][C]23[/C][C]0.21208[/C][C]2.3135[/C][C]0.011205[/C][/ROW]
[ROW][C]24[/C][C]0.293139[/C][C]3.1978[/C][C]0.000887[/C][/ROW]
[ROW][C]25[/C][C]0.114051[/C][C]1.2442[/C][C]0.107945[/C][/ROW]
[ROW][C]26[/C][C]0.013856[/C][C]0.1512[/C][C]0.440056[/C][/ROW]
[ROW][C]27[/C][C]-0.041812[/C][C]-0.4561[/C][C]0.324568[/C][/ROW]
[ROW][C]28[/C][C]-0.151219[/C][C]-1.6496[/C][C]0.050831[/C][/ROW]
[ROW][C]29[/C][C]0.03338[/C][C]0.3641[/C][C]0.358203[/C][/ROW]
[ROW][C]30[/C][C]-0.131679[/C][C]-1.4364[/C][C]0.07675[/C][/ROW]
[ROW][C]31[/C][C]-0.154173[/C][C]-1.6818[/C][C]0.047613[/C][/ROW]
[ROW][C]32[/C][C]-0.068961[/C][C]-0.7523[/C][C]0.226684[/C][/ROW]
[ROW][C]33[/C][C]-0.028877[/C][C]-0.315[/C][C]0.376654[/C][/ROW]
[ROW][C]34[/C][C]0.030545[/C][C]0.3332[/C][C]0.369782[/C][/ROW]
[ROW][C]35[/C][C]0.210452[/C][C]2.2958[/C][C]0.01172[/C][/ROW]
[ROW][C]36[/C][C]0.128458[/C][C]1.4013[/C][C]0.081862[/C][/ROW]
[ROW][C]37[/C][C]0.016199[/C][C]0.1767[/C][C]0.43002[/C][/ROW]
[ROW][C]38[/C][C]0.060386[/C][C]0.6587[/C][C]0.255669[/C][/ROW]
[ROW][C]39[/C][C]-0.031829[/C][C]-0.3472[/C][C]0.364522[/C][/ROW]
[ROW][C]40[/C][C]-0.132669[/C][C]-1.4472[/C][C]0.075229[/C][/ROW]
[ROW][C]41[/C][C]-0.108039[/C][C]-1.1786[/C][C]0.120462[/C][/ROW]
[ROW][C]42[/C][C]-0.059215[/C][C]-0.646[/C][C]0.259775[/C][/ROW]
[ROW][C]43[/C][C]-0.175852[/C][C]-1.9183[/C][C]0.028734[/C][/ROW]
[ROW][C]44[/C][C]-0.044283[/C][C]-0.4831[/C][C]0.314965[/C][/ROW]
[ROW][C]45[/C][C]0.040634[/C][C]0.4433[/C][C]0.329191[/C][/ROW]
[ROW][C]46[/C][C]-0.058708[/C][C]-0.6404[/C][C]0.261562[/C][/ROW]
[ROW][C]47[/C][C]0.18452[/C][C]2.0129[/C][C]0.023193[/C][/ROW]
[ROW][C]48[/C][C]0.104749[/C][C]1.1427[/C][C]0.127734[/C][/ROW]
[/TABLE]
Source: https://freestatistics.org/blog/index.php?pk=143029&T=1

Globally Unique Identifier (entire table): ba.freestatistics.org/blog/index.php?pk=143029&T=1

As an alternative you can also use a QR Code:  

The GUIDs for individual cells are displayed in the table below:

Autocorrelation Function
Time lag kACF(k)T-STATP-value
10.0998271.0890.139182
20.0843180.91980.17977
3-0.095272-1.03930.150388
4-0.211455-2.30670.0114
5-0.182368-1.98940.024475
6-0.075632-0.8250.205498
7-0.240818-2.6270.004874
8-0.183676-2.00370.023688
90.0259130.28270.388956
100.1319481.43940.076334
110.129161.4090.080726
120.339913.7080.000159
130.1298211.41620.079668
140.0233850.25510.399543
150.0268820.29320.384923
16-0.276258-3.01360.001578
17-0.085808-0.9360.175572
18-0.131398-1.43340.077186
19-0.127862-1.39480.082835
20-0.120418-1.31360.095753
21-0.057753-0.630.264946
220.0336020.36660.3573
230.212082.31350.011205
240.2931393.19780.000887
250.1140511.24420.107945
260.0138560.15120.440056
27-0.041812-0.45610.324568
28-0.151219-1.64960.050831
290.033380.36410.358203
30-0.131679-1.43640.07675
31-0.154173-1.68180.047613
32-0.068961-0.75230.226684
33-0.028877-0.3150.376654
340.0305450.33320.369782
350.2104522.29580.01172
360.1284581.40130.081862
370.0161990.17670.43002
380.0603860.65870.255669
39-0.031829-0.34720.364522
40-0.132669-1.44720.075229
41-0.108039-1.17860.120462
42-0.059215-0.6460.259775
43-0.175852-1.91830.028734
44-0.044283-0.48310.314965
450.0406340.44330.329191
46-0.058708-0.64040.261562
470.184522.01290.023193
480.1047491.14270.127734


Partial Autocorrelation Function
Time lag kPACF(k)T-STATP-value
10.0998271.0890.139182
20.0751010.81930.207141
3-0.1123-1.2250.111488
4-0.203544-2.22040.014143
5-0.137412-1.4990.068262
6-0.027196-0.29670.383615
7-0.265617-2.89750.002239
8-0.261633-2.85410.002546
9-0.016943-0.18480.426841
100.0659730.71970.236567
11-0.062981-0.6870.246697
120.189692.06930.020343
130.1032591.12640.131126
14-0.016556-0.18060.428491
150.044830.4890.312857
16-0.196045-2.13860.017256
170.087120.95040.171927
18-0.018553-0.20240.419978
19-0.066273-0.72290.235565
20-0.084606-0.92290.178952
21-0.130832-1.42720.078069
22-0.057123-0.62310.267193
230.0474280.51740.302928
240.0937921.02310.154156
25-0.019461-0.21230.416121
26-0.015688-0.17110.432203
27-0.036172-0.39460.346928
28-0.002563-0.0280.488872
290.1503731.64040.051783
30-0.052165-0.56910.285197
31-0.008504-0.09280.463123
320.0068930.07520.470093
330.0200860.21910.413471
34-0.063209-0.68950.245917
350.0612440.66810.252685
36-0.003979-0.04340.482726
37-0.11717-1.27820.101837
380.0006440.0070.497201
39-0.004575-0.04990.48014
40-0.029088-0.31730.375781
41-0.199525-2.17660.015744
420.0232910.25410.399938
43-0.076707-0.83680.202198
44-0.124033-1.3530.089305
450.0906660.9890.162323
46-0.200668-2.1890.015273
470.0171140.18670.426111
48-0.119252-1.30090.097905

\begin{tabular}{lllllllll}
\hline
Partial Autocorrelation Function \tabularnewline
Time lag k & PACF(k) & T-STAT & P-value \tabularnewline
1 & 0.099827 & 1.089 & 0.139182 \tabularnewline
2 & 0.075101 & 0.8193 & 0.207141 \tabularnewline
3 & -0.1123 & -1.225 & 0.111488 \tabularnewline
4 & -0.203544 & -2.2204 & 0.014143 \tabularnewline
5 & -0.137412 & -1.499 & 0.068262 \tabularnewline
6 & -0.027196 & -0.2967 & 0.383615 \tabularnewline
7 & -0.265617 & -2.8975 & 0.002239 \tabularnewline
8 & -0.261633 & -2.8541 & 0.002546 \tabularnewline
9 & -0.016943 & -0.1848 & 0.426841 \tabularnewline
10 & 0.065973 & 0.7197 & 0.236567 \tabularnewline
11 & -0.062981 & -0.687 & 0.246697 \tabularnewline
12 & 0.18969 & 2.0693 & 0.020343 \tabularnewline
13 & 0.103259 & 1.1264 & 0.131126 \tabularnewline
14 & -0.016556 & -0.1806 & 0.428491 \tabularnewline
15 & 0.04483 & 0.489 & 0.312857 \tabularnewline
16 & -0.196045 & -2.1386 & 0.017256 \tabularnewline
17 & 0.08712 & 0.9504 & 0.171927 \tabularnewline
18 & -0.018553 & -0.2024 & 0.419978 \tabularnewline
19 & -0.066273 & -0.7229 & 0.235565 \tabularnewline
20 & -0.084606 & -0.9229 & 0.178952 \tabularnewline
21 & -0.130832 & -1.4272 & 0.078069 \tabularnewline
22 & -0.057123 & -0.6231 & 0.267193 \tabularnewline
23 & 0.047428 & 0.5174 & 0.302928 \tabularnewline
24 & 0.093792 & 1.0231 & 0.154156 \tabularnewline
25 & -0.019461 & -0.2123 & 0.416121 \tabularnewline
26 & -0.015688 & -0.1711 & 0.432203 \tabularnewline
27 & -0.036172 & -0.3946 & 0.346928 \tabularnewline
28 & -0.002563 & -0.028 & 0.488872 \tabularnewline
29 & 0.150373 & 1.6404 & 0.051783 \tabularnewline
30 & -0.052165 & -0.5691 & 0.285197 \tabularnewline
31 & -0.008504 & -0.0928 & 0.463123 \tabularnewline
32 & 0.006893 & 0.0752 & 0.470093 \tabularnewline
33 & 0.020086 & 0.2191 & 0.413471 \tabularnewline
34 & -0.063209 & -0.6895 & 0.245917 \tabularnewline
35 & 0.061244 & 0.6681 & 0.252685 \tabularnewline
36 & -0.003979 & -0.0434 & 0.482726 \tabularnewline
37 & -0.11717 & -1.2782 & 0.101837 \tabularnewline
38 & 0.000644 & 0.007 & 0.497201 \tabularnewline
39 & -0.004575 & -0.0499 & 0.48014 \tabularnewline
40 & -0.029088 & -0.3173 & 0.375781 \tabularnewline
41 & -0.199525 & -2.1766 & 0.015744 \tabularnewline
42 & 0.023291 & 0.2541 & 0.399938 \tabularnewline
43 & -0.076707 & -0.8368 & 0.202198 \tabularnewline
44 & -0.124033 & -1.353 & 0.089305 \tabularnewline
45 & 0.090666 & 0.989 & 0.162323 \tabularnewline
46 & -0.200668 & -2.189 & 0.015273 \tabularnewline
47 & 0.017114 & 0.1867 & 0.426111 \tabularnewline
48 & -0.119252 & -1.3009 & 0.097905 \tabularnewline
\hline
\end{tabular}
%Source: https://freestatistics.org/blog/index.php?pk=143029&T=2

[TABLE]
[ROW][C]Partial Autocorrelation Function[/C][/ROW]
[ROW][C]Time lag k[/C][C]PACF(k)[/C][C]T-STAT[/C][C]P-value[/C][/ROW]
[ROW][C]1[/C][C]0.099827[/C][C]1.089[/C][C]0.139182[/C][/ROW]
[ROW][C]2[/C][C]0.075101[/C][C]0.8193[/C][C]0.207141[/C][/ROW]
[ROW][C]3[/C][C]-0.1123[/C][C]-1.225[/C][C]0.111488[/C][/ROW]
[ROW][C]4[/C][C]-0.203544[/C][C]-2.2204[/C][C]0.014143[/C][/ROW]
[ROW][C]5[/C][C]-0.137412[/C][C]-1.499[/C][C]0.068262[/C][/ROW]
[ROW][C]6[/C][C]-0.027196[/C][C]-0.2967[/C][C]0.383615[/C][/ROW]
[ROW][C]7[/C][C]-0.265617[/C][C]-2.8975[/C][C]0.002239[/C][/ROW]
[ROW][C]8[/C][C]-0.261633[/C][C]-2.8541[/C][C]0.002546[/C][/ROW]
[ROW][C]9[/C][C]-0.016943[/C][C]-0.1848[/C][C]0.426841[/C][/ROW]
[ROW][C]10[/C][C]0.065973[/C][C]0.7197[/C][C]0.236567[/C][/ROW]
[ROW][C]11[/C][C]-0.062981[/C][C]-0.687[/C][C]0.246697[/C][/ROW]
[ROW][C]12[/C][C]0.18969[/C][C]2.0693[/C][C]0.020343[/C][/ROW]
[ROW][C]13[/C][C]0.103259[/C][C]1.1264[/C][C]0.131126[/C][/ROW]
[ROW][C]14[/C][C]-0.016556[/C][C]-0.1806[/C][C]0.428491[/C][/ROW]
[ROW][C]15[/C][C]0.04483[/C][C]0.489[/C][C]0.312857[/C][/ROW]
[ROW][C]16[/C][C]-0.196045[/C][C]-2.1386[/C][C]0.017256[/C][/ROW]
[ROW][C]17[/C][C]0.08712[/C][C]0.9504[/C][C]0.171927[/C][/ROW]
[ROW][C]18[/C][C]-0.018553[/C][C]-0.2024[/C][C]0.419978[/C][/ROW]
[ROW][C]19[/C][C]-0.066273[/C][C]-0.7229[/C][C]0.235565[/C][/ROW]
[ROW][C]20[/C][C]-0.084606[/C][C]-0.9229[/C][C]0.178952[/C][/ROW]
[ROW][C]21[/C][C]-0.130832[/C][C]-1.4272[/C][C]0.078069[/C][/ROW]
[ROW][C]22[/C][C]-0.057123[/C][C]-0.6231[/C][C]0.267193[/C][/ROW]
[ROW][C]23[/C][C]0.047428[/C][C]0.5174[/C][C]0.302928[/C][/ROW]
[ROW][C]24[/C][C]0.093792[/C][C]1.0231[/C][C]0.154156[/C][/ROW]
[ROW][C]25[/C][C]-0.019461[/C][C]-0.2123[/C][C]0.416121[/C][/ROW]
[ROW][C]26[/C][C]-0.015688[/C][C]-0.1711[/C][C]0.432203[/C][/ROW]
[ROW][C]27[/C][C]-0.036172[/C][C]-0.3946[/C][C]0.346928[/C][/ROW]
[ROW][C]28[/C][C]-0.002563[/C][C]-0.028[/C][C]0.488872[/C][/ROW]
[ROW][C]29[/C][C]0.150373[/C][C]1.6404[/C][C]0.051783[/C][/ROW]
[ROW][C]30[/C][C]-0.052165[/C][C]-0.5691[/C][C]0.285197[/C][/ROW]
[ROW][C]31[/C][C]-0.008504[/C][C]-0.0928[/C][C]0.463123[/C][/ROW]
[ROW][C]32[/C][C]0.006893[/C][C]0.0752[/C][C]0.470093[/C][/ROW]
[ROW][C]33[/C][C]0.020086[/C][C]0.2191[/C][C]0.413471[/C][/ROW]
[ROW][C]34[/C][C]-0.063209[/C][C]-0.6895[/C][C]0.245917[/C][/ROW]
[ROW][C]35[/C][C]0.061244[/C][C]0.6681[/C][C]0.252685[/C][/ROW]
[ROW][C]36[/C][C]-0.003979[/C][C]-0.0434[/C][C]0.482726[/C][/ROW]
[ROW][C]37[/C][C]-0.11717[/C][C]-1.2782[/C][C]0.101837[/C][/ROW]
[ROW][C]38[/C][C]0.000644[/C][C]0.007[/C][C]0.497201[/C][/ROW]
[ROW][C]39[/C][C]-0.004575[/C][C]-0.0499[/C][C]0.48014[/C][/ROW]
[ROW][C]40[/C][C]-0.029088[/C][C]-0.3173[/C][C]0.375781[/C][/ROW]
[ROW][C]41[/C][C]-0.199525[/C][C]-2.1766[/C][C]0.015744[/C][/ROW]
[ROW][C]42[/C][C]0.023291[/C][C]0.2541[/C][C]0.399938[/C][/ROW]
[ROW][C]43[/C][C]-0.076707[/C][C]-0.8368[/C][C]0.202198[/C][/ROW]
[ROW][C]44[/C][C]-0.124033[/C][C]-1.353[/C][C]0.089305[/C][/ROW]
[ROW][C]45[/C][C]0.090666[/C][C]0.989[/C][C]0.162323[/C][/ROW]
[ROW][C]46[/C][C]-0.200668[/C][C]-2.189[/C][C]0.015273[/C][/ROW]
[ROW][C]47[/C][C]0.017114[/C][C]0.1867[/C][C]0.426111[/C][/ROW]
[ROW][C]48[/C][C]-0.119252[/C][C]-1.3009[/C][C]0.097905[/C][/ROW]
[/TABLE]
Source: https://freestatistics.org/blog/index.php?pk=143029&T=2

Globally Unique Identifier (entire table): ba.freestatistics.org/blog/index.php?pk=143029&T=2

As an alternative you can also use a QR Code:  

The GUIDs for individual cells are displayed in the table below:

Partial Autocorrelation Function
Time lag kPACF(k)T-STATP-value
10.0998271.0890.139182
20.0751010.81930.207141
3-0.1123-1.2250.111488
4-0.203544-2.22040.014143
5-0.137412-1.4990.068262
6-0.027196-0.29670.383615
7-0.265617-2.89750.002239
8-0.261633-2.85410.002546
9-0.016943-0.18480.426841
100.0659730.71970.236567
11-0.062981-0.6870.246697
120.189692.06930.020343
130.1032591.12640.131126
14-0.016556-0.18060.428491
150.044830.4890.312857
16-0.196045-2.13860.017256
170.087120.95040.171927
18-0.018553-0.20240.419978
19-0.066273-0.72290.235565
20-0.084606-0.92290.178952
21-0.130832-1.42720.078069
22-0.057123-0.62310.267193
230.0474280.51740.302928
240.0937921.02310.154156
25-0.019461-0.21230.416121
26-0.015688-0.17110.432203
27-0.036172-0.39460.346928
28-0.002563-0.0280.488872
290.1503731.64040.051783
30-0.052165-0.56910.285197
31-0.008504-0.09280.463123
320.0068930.07520.470093
330.0200860.21910.413471
34-0.063209-0.68950.245917
350.0612440.66810.252685
36-0.003979-0.04340.482726
37-0.11717-1.27820.101837
380.0006440.0070.497201
39-0.004575-0.04990.48014
40-0.029088-0.31730.375781
41-0.199525-2.17660.015744
420.0232910.25410.399938
43-0.076707-0.83680.202198
44-0.124033-1.3530.089305
450.0906660.9890.162323
46-0.200668-2.1890.015273
470.0171140.18670.426111
48-0.119252-1.30090.097905


Parameters (Session):
par1 = 48 ; par2 = 1 ; par3 = 1 ; par4 = 0 ; par5 = 12 ; par6 = White Noise ; par7 = 0.95 ;
Parameters (R input):
par1 = 48 ; par2 = 1 ; par3 = 1 ; par4 = 0 ; par5 = 12 ; par6 = White Noise ; par7 = 0.95 ; par8 = ;
R code (references can be found in the software module):
if (par1 == 'Default') {
par1 = 10*log10(length(x))
} else {
par1 <- as.numeric(par1)
}
par2 <- as.numeric(par2)
par3 <- as.numeric(par3)
par4 <- as.numeric(par4)
par5 <- as.numeric(par5)
if (par6 == 'White Noise') par6 <- 'white' else par6 <- 'ma'
par7 <- as.numeric(par7)
if (par8 != '') par8 <- as.numeric(par8)
ox <- x
if (par8 == '') {
if (par2 == 0) {
x <- log(x)
} else {
x <- (x ^ par2 - 1) / par2
}
} else {
x <- log(x,base=par8)
}
if (par3 > 0) x <- diff(x,lag=1,difference=par3)
if (par4 > 0) x <- diff(x,lag=par5,difference=par4)
bitmap(file='picts.png')
op <- par(mfrow=c(2,1))
plot(ox,type='l',main='Original Time Series',xlab='time',ylab='value')
if (par8=='') {
mytitle <- paste('Working Time Series (lambda=',par2,', d=',par3,', D=',par4,')',sep='')
mysub <- paste('(lambda=',par2,', d=',par3,', D=',par4,', CI=', par7, ', CI type=',par6,')',sep='')
} else {
mytitle <- paste('Working Time Series (base=',par8,', d=',par3,', D=',par4,')',sep='')
mysub <- paste('(base=',par8,', d=',par3,', D=',par4,', CI=', par7, ', CI type=',par6,')',sep='')
}
plot(x,type='l', main=mytitle,xlab='time',ylab='value')
par(op)
dev.off()
bitmap(file='pic1.png')
racf <- acf(x, par1, main='Autocorrelation', xlab='time lag', ylab='ACF', ci.type=par6, ci=par7, sub=mysub)
dev.off()
bitmap(file='pic2.png')
rpacf <- pacf(x,par1,main='Partial Autocorrelation',xlab='lags',ylab='PACF',sub=mysub)
dev.off()
(myacf <- c(racf$acf))
(mypacf <- c(rpacf$acf))
lengthx <- length(x)
sqrtn <- sqrt(lengthx)
load(file='createtable')
a<-table.start()
a<-table.row.start(a)
a<-table.element(a,'Autocorrelation Function',4,TRUE)
a<-table.row.end(a)
a<-table.row.start(a)
a<-table.element(a,'Time lag k',header=TRUE)
a<-table.element(a,hyperlink('basics.htm','ACF(k)','click here for more information about the Autocorrelation Function'),header=TRUE)
a<-table.element(a,'T-STAT',header=TRUE)
a<-table.element(a,'P-value',header=TRUE)
a<-table.row.end(a)
for (i in 2:(par1+1)) {
a<-table.row.start(a)
a<-table.element(a,i-1,header=TRUE)
a<-table.element(a,round(myacf[i],6))
mytstat <- myacf[i]*sqrtn
a<-table.element(a,round(mytstat,4))
a<-table.element(a,round(1-pt(abs(mytstat),lengthx),6))
a<-table.row.end(a)
}
a<-table.end(a)
table.save(a,file='mytable.tab')
a<-table.start()
a<-table.row.start(a)
a<-table.element(a,'Partial Autocorrelation Function',4,TRUE)
a<-table.row.end(a)
a<-table.row.start(a)
a<-table.element(a,'Time lag k',header=TRUE)
a<-table.element(a,hyperlink('basics.htm','PACF(k)','click here for more information about the Partial Autocorrelation Function'),header=TRUE)
a<-table.element(a,'T-STAT',header=TRUE)
a<-table.element(a,'P-value',header=TRUE)
a<-table.row.end(a)
for (i in 1:par1) {
a<-table.row.start(a)
a<-table.element(a,i,header=TRUE)
a<-table.element(a,round(mypacf[i],6))
mytstat <- mypacf[i]*sqrtn
a<-table.element(a,round(mytstat,4))
a<-table.element(a,round(1-pt(abs(mytstat),lengthx),6))
a<-table.row.end(a)
}
a<-table.end(a)
table.save(a,file='mytable1.tab')