Free Statistics

of Irreproducible Research!

Author's title

Author*The author of this computation has been verified*
R Software Modulerwasp_Distributional Plots.wasp
Title produced by softwareHistogram, QQplot and Density
Date of computationTue, 15 Nov 2011 09:55:51 -0500
Cite this page as followsStatistical Computations at FreeStatistics.org, Office for Research Development and Education, URL https://freestatistics.org/blog/index.php?v=date/2011/Nov/15/t1321368998337rfw7hej7yimc.htm/, Retrieved Sat, 20 Apr 2024 10:55:09 +0000
Statistical Computations at FreeStatistics.org, Office for Research Development and Education, URL https://freestatistics.org/blog/index.php?pk=142983, Retrieved Sat, 20 Apr 2024 10:55:09 +0000
QR Codes:

Original text written by user:
IsPrivate?No (this computation is public)
User-defined keywords
Estimated Impact131
Family? (F = Feedback message, R = changed R code, M = changed R Module, P = changed Parameters, D = changed Data)
-       [Histogram, QQplot and Density] [] [2011-11-15 14:55:51] [898f528db62d66cb4fd17f9b6ea3eb9d] [Current]
Feedback Forum

Post a new message
Dataseries X:
70.18
69.94
69.61
71.39
72.54
70.48
70.48
71.68
70.59
71.61
70.56
72.74
72.63
71.58
70.14
71.22
70.72
71.37
69.73
71.29
73.19
70.64
69.3
71.76
70.28
69.77
70.37
71.7
70.85
71.07


Summary of computational transaction
Raw Inputview raw input (R code)
Raw Outputview raw output of R engine
Computing time1 seconds
R Server'Gertrude Mary Cox' @ cox.wessa.net

\begin{tabular}{lllllllll}
\hline
Summary of computational transaction \tabularnewline
Raw Input & view raw input (R code)  \tabularnewline
Raw Output & view raw output of R engine  \tabularnewline
Computing time & 1 seconds \tabularnewline
R Server & 'Gertrude Mary Cox' @ cox.wessa.net \tabularnewline
\hline
\end{tabular}
%Source: https://freestatistics.org/blog/index.php?pk=142983&T=0

[TABLE]
[ROW][C]Summary of computational transaction[/C][/ROW]
[ROW][C]Raw Input[/C][C]view raw input (R code) [/C][/ROW]
[ROW][C]Raw Output[/C][C]view raw output of R engine [/C][/ROW]
[ROW][C]Computing time[/C][C]1 seconds[/C][/ROW]
[ROW][C]R Server[/C][C]'Gertrude Mary Cox' @ cox.wessa.net[/C][/ROW]
[/TABLE]
Source: https://freestatistics.org/blog/index.php?pk=142983&T=0

Globally Unique Identifier (entire table): ba.freestatistics.org/blog/index.php?pk=142983&T=0

As an alternative you can also use a QR Code:  

The GUIDs for individual cells are displayed in the table below:

Summary of computational transaction
Raw Inputview raw input (R code)
Raw Outputview raw output of R engine
Computing time1 seconds
R Server'Gertrude Mary Cox' @ cox.wessa.net


Descriptive Statistics
mean70.9803formula
standard deviation0.983262formula

\begin{tabular}{lllllllll}
\hline
Descriptive Statistics \tabularnewline
mean & 70.9803 & formula \tabularnewline
standard deviation & 0.983262 & formula \tabularnewline
\hline
\end{tabular}
%Source: https://freestatistics.org/blog/index.php?pk=142983&T=1

[TABLE]
[ROW][C]Descriptive Statistics[/C][/ROW]
[ROW][C]mean[/C][C]70.9803[/C][C]formula[/C][/ROW]
[ROW][C]standard deviation[/C][C]0.983262[/C][C]formula[/C][/ROW]
[/TABLE]
Source: https://freestatistics.org/blog/index.php?pk=142983&T=1

Globally Unique Identifier (entire table): ba.freestatistics.org/blog/index.php?pk=142983&T=1

As an alternative you can also use a QR Code:  

The GUIDs for individual cells are displayed in the table below:

Descriptive Statistics
mean70.9803formula
standard deviation0.983262formula


Parameters (Session):
par1 = 10 ;
Parameters (R input):
par1 = 10 ;
R code (references can be found in the software module):
bitmap(file='test1.png')
par1 <- as.numeric(par1)
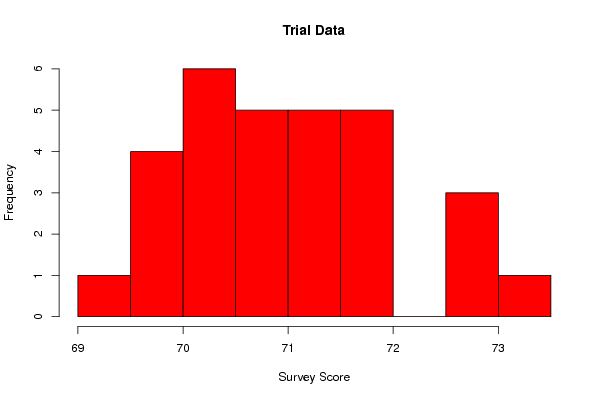
myhist<-hist(x, breaks=par1, col=2, xlab=xlab, main=main)
dev.off()
bitmap(file='test2.png')
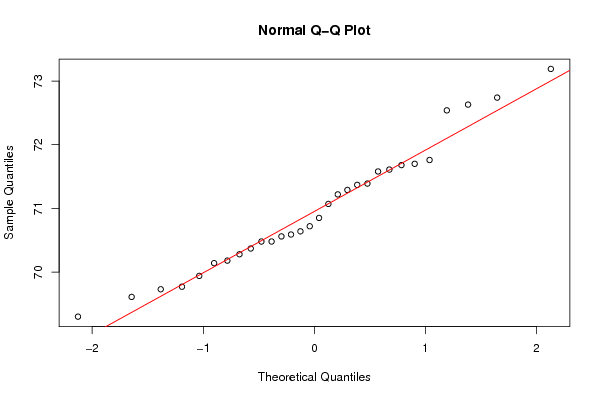
qqnorm(x)
qqline(x, col=2)
dev.off()
bitmap(file='test3.png')
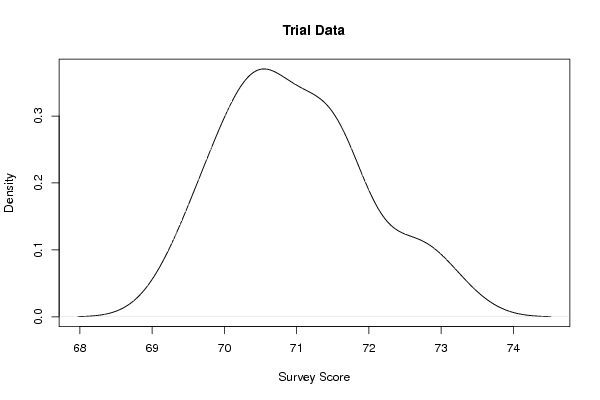
plot(density(x), xlab=xlab, main=main)
dev.off()
load(file='createtable')
a<-table.start()
a<-table.row.start(a)
a<-table.element(a,'Descriptive Statistics',3,TRUE)
a<-table.row.end(a)
a<-table.row.start(a)
a<-table.element(a,'mean',header=TRUE)
a<-table.element(a,signif(mean(x), 6))
a<-table.element(a,hyperlink('arithmetic_mean.htm','formula','click to see the formula'))
a<-table.row.end(a)
a<-table.row.start(a)
a<-table.element(a,'standard deviation',header=TRUE)
a<-table.element(a,signif(sd(x), 6))
a<-table.element(a,hyperlink('unbiased1.htm','formula','click to see the formula'))
a<-table.row.end(a)
a<-table.end(a)
table.save(a,file='mytable.tab')