Free Statistics
of Irreproducible Research!
Description of Statistical Computation | |||||||||||||||||||||||||||||||||||||||||||||||||||||
|---|---|---|---|---|---|---|---|---|---|---|---|---|---|---|---|---|---|---|---|---|---|---|---|---|---|---|---|---|---|---|---|---|---|---|---|---|---|---|---|---|---|---|---|---|---|---|---|---|---|---|---|---|---|
| Author's title | |||||||||||||||||||||||||||||||||||||||||||||||||||||
| Author | *The author of this computation has been verified* | ||||||||||||||||||||||||||||||||||||||||||||||||||||
| R Software Module | rwasp_bidataseries.wasp | ||||||||||||||||||||||||||||||||||||||||||||||||||||
| Title produced by software | Bivariate Data Series | ||||||||||||||||||||||||||||||||||||||||||||||||||||
| Date of computation | Tue, 15 Nov 2011 09:35:12 -0500 | ||||||||||||||||||||||||||||||||||||||||||||||||||||
| Cite this page as follows | Statistical Computations at FreeStatistics.org, Office for Research Development and Education, URL https://freestatistics.org/blog/index.php?v=date/2011/Nov/15/t1321367721o2y7a676e23nx45.htm/, Retrieved Sun, 13 Jul 2025 04:01:49 +0000 | ||||||||||||||||||||||||||||||||||||||||||||||||||||
| Statistical Computations at FreeStatistics.org, Office for Research Development and Education, URL https://freestatistics.org/blog/index.php?pk=142932, Retrieved Sun, 13 Jul 2025 04:01:49 +0000 | |||||||||||||||||||||||||||||||||||||||||||||||||||||
| QR Codes: | |||||||||||||||||||||||||||||||||||||||||||||||||||||
|
| |||||||||||||||||||||||||||||||||||||||||||||||||||||
| Original text written by user: | |||||||||||||||||||||||||||||||||||||||||||||||||||||
| IsPrivate? | No (this computation is public) | ||||||||||||||||||||||||||||||||||||||||||||||||||||
| User-defined keywords | |||||||||||||||||||||||||||||||||||||||||||||||||||||
| Estimated Impact | 144 | ||||||||||||||||||||||||||||||||||||||||||||||||||||
Tree of Dependent Computations | |||||||||||||||||||||||||||||||||||||||||||||||||||||
| Family? (F = Feedback message, R = changed R code, M = changed R Module, P = changed Parameters, D = changed Data) | |||||||||||||||||||||||||||||||||||||||||||||||||||||
| - [Bivariate Data Series] [Bivariate dataset] [2008-01-05 23:51:08] [74be16979710d4c4e7c6647856088456] - RMPD [Bivariate Data Series] [] [2011-11-15 14:35:12] [885a9dbaf162325773a0a0afdf9f947e] [Current] | |||||||||||||||||||||||||||||||||||||||||||||||||||||
| Feedback Forum | |||||||||||||||||||||||||||||||||||||||||||||||||||||
Post a new message | |||||||||||||||||||||||||||||||||||||||||||||||||||||
Dataset | |||||||||||||||||||||||||||||||||||||||||||||||||||||
| Dataseries X: | |||||||||||||||||||||||||||||||||||||||||||||||||||||
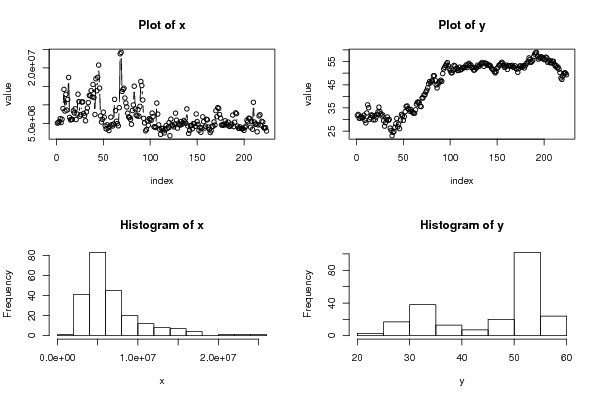
5097733 5211195 5504732 6320543 5211017 6130767 9008579 14188058 8341348 12852591 8579993 11468330 17398343 6618449 5935785 6134237 6081770 8398224 7821842 8952839 6052714 7565780 12885515 10894059 6939086 7391602 10768185 10812563 7695058 7093838 5714231 8088670 9170085 10629761 12574993 12463612 13875028 12155525 15510046 11993564 7416020 17039709 13808456 17436191 20741379 14531541 7030184 5381555 6093978 8030856 6654971 4334480 3529587 4619563 3759042 3069262 4245675 6700810 4688014 4306550 4852311 11491957 8441892 5597295 4969173 4357050 9255803 23781732 24175367 13631565 14198942 14490048 11854384 10515925 9436128 7770536 6754512 6589372 6095620 4780724 8503349 9986591 15040788 8903608 7276738 7043018 8714346 6946482 9614191 16322812 15211050 11325054 6376991 5158216 2999895 3355832 5673842 4514464 6281859 6070157 5829724 7785907 6840199 4073233 4081296 3908174 10491399 7512203 4633572 3443958 2052808 3617640 3677766 3001914 2450147 3364952 4456372 3597061 3989401 5202601 1694038 6172358 4616170 4421297 4077442 4798465 7773827 5885975 3731669 5052823 4683420 4544706 5521504 4810233 5130308 5814166 5411181 5035588 8919369 4324406 2318805 3084786 4336218 4470617 3545343 4940466 4922521 4210177 7553838 5517784 4760142 3133522 3982480 2613087 3769980 6777217 5496550 3764597 4252002 6122572 5985953 4021659 3392884 2557363 3014256 4246818 4230825 5418276 4584401 8440104 6815202 9269390 9040389 7392801 6429277 4606580 4505429 4651582 4614287 5715481 5001690 4565738 5377159 4281720 4205807 4552453 4823901 7256091 4144826 5323040 7872937 7644045 4279241 3737402 3650627 4048379 3683989 3556080 3626260 3148600 3970330 4264242 5858029 5434075 6411677 6306918 3980740 5607870 3434313 10700611 5378005 4798833 4837746 2742747 4622989 7026327 7342278 4564750 5577201 5394217 3864414 3726931 3878155 2962587 | |||||||||||||||||||||||||||||||||||||||||||||||||||||
| Dataseries Y: | |||||||||||||||||||||||||||||||||||||||||||||||||||||
31.82 32.23 30.51 30.68 31.32 30.77 30.88 31.92 29.68 28.56 32.85 36.35 35.13 30.05 30.80 32.00 31.78 29.92 31.77 29.93 31.05 32.25 33.34 35.35 33.45 32.48 31.55 32.02 29.49 27.18 28.66 30.05 31.14 29.66 30.05 26.32 25.32 23.06 24.45 24.91 26.65 28.20 30.50 26.90 28.00 26.12 29.80 32.23 31.64 29.66 31.30 33.42 35.65 35.87 34.73 34.40 33.56 34.36 33.45 32.98 32.72 32.75 34.21 36.69 37.50 37.52 37.23 35.72 35.61 39.34 39.31 40.62 40.62 41.80 42.60 43.67 45.47 46.40 45.84 46.59 46.70 48.81 48.92 46.95 44.90 43.63 45.28 46.05 46.51 46.95 46.45 49.82 51.82 52.50 53.25 53.95 54.54 53.23 52.00 51.13 50.16 50.19 51.28 53.34 53.08 51.75 52.20 51.11 51.30 52.61 51.41 51.61 52.35 52.21 52.64 52.50 53.55 52.41 53.80 54.22 53.21 53.50 52.30 52.47 51.32 51.37 52.32 52.24 53.40 52.83 53.08 53.62 54.14 54.62 54.13 52.94 54.43 53.98 54.05 53.45 53.39 53.43 53.03 52.16 51.72 51.42 50.54 50.13 50.63 52.10 52.64 53.47 53.39 54.11 54.70 54.34 53.39 52.47 52.74 53.44 51.61 53.30 53.10 53.26 53.09 53.39 52.56 52.57 53.18 52.00 51.75 50.34 51.96 53.07 53.14 52.60 52.70 53.20 52.23 53.21 54.17 54.33 55.12 56.58 55.91 54.65 55.03 55.56 57.15 58.24 58.77 58.97 57.29 56.04 56.72 56.46 57.10 56.81 56.32 55.81 56.03 56.90 56.59 54.60 55.08 55.48 54.42 54.55 55.17 55.10 53.89 53.02 53.24 52.32 52.57 51.69 50.26 47.94 47.32 48.72 49.84 50.15 50.00 49.34 | |||||||||||||||||||||||||||||||||||||||||||||||||||||
Tables (Output of Computation) | |||||||||||||||||||||||||||||||||||||||||||||||||||||
| |||||||||||||||||||||||||||||||||||||||||||||||||||||
Figures (Output of Computation) | |||||||||||||||||||||||||||||||||||||||||||||||||||||
Input Parameters & R Code | |||||||||||||||||||||||||||||||||||||||||||||||||||||
| Parameters (Session): | |||||||||||||||||||||||||||||||||||||||||||||||||||||
| par1 = volume verhandeld ; par3 = Volume ; par4 = slotkoers ; par5 = koers ; | |||||||||||||||||||||||||||||||||||||||||||||||||||||
| Parameters (R input): | |||||||||||||||||||||||||||||||||||||||||||||||||||||
| par1 = volume verhandeld ; par2 = ; par3 = Volume ; par4 = slotkoers ; par5 = koers ; par6 = ; | |||||||||||||||||||||||||||||||||||||||||||||||||||||
| R code (references can be found in the software module): | |||||||||||||||||||||||||||||||||||||||||||||||||||||
bitmap(file='test1.png') | |||||||||||||||||||||||||||||||||||||||||||||||||||||