| Tabulation of Results | ||
| connected x learning | ||
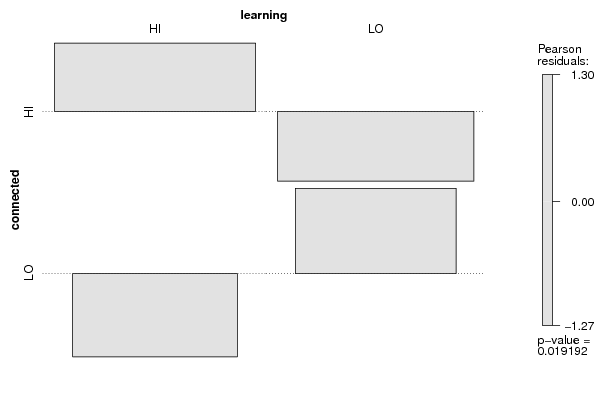
| HI | LO | HI | 57 | 40 | LO | 26 | 39 |
| Tabulation of Expected Results | ||
| connected x learning | ||
| HI | LO | HI | 49.7 | 47.3 | LO | 33.3 | 31.7 |
| Statistical Results | |
| Pearson's Chi-squared test with Yates' continuity correction | |
| Pearson Chi Square Statistic | 4.76 |
| Degrees of Freedom | 1 |
| P value | 0.03 |