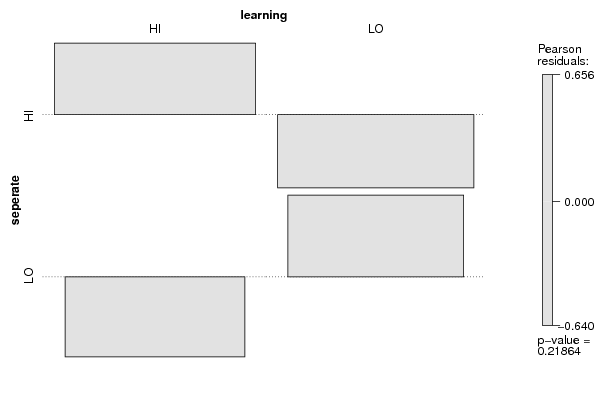
| Tabulation of Results | ||
| seperate x learning | ||
| HI | LO | HI | 50 | 40 | LO | 33 | 39 |
| Tabulation of Expected Results | ||
| seperate x learning | ||
| HI | LO | HI | 46.11 | 43.89 | LO | 36.89 | 35.11 |
| Statistical Results | |
| Pearson's Chi-squared test with Yates' continuity correction | |
| Pearson Chi Square Statistic | 1.15 |
| Degrees of Freedom | 1 |
| P value | 0.28 |