| Tabulation of Results | ||
| Depression x Connected | ||
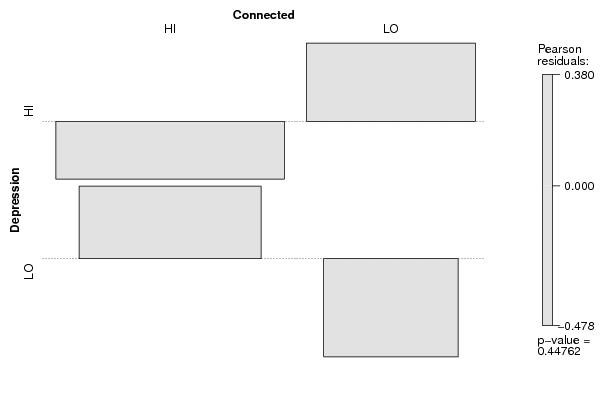
| HI | LO | HI | 44 | 27 | LO | 31 | 14 |
| Tabulation of Expected Results | ||
| Depression x Connected | ||
| HI | LO | HI | 45.91 | 25.09 | LO | 29.09 | 15.91 |
| Statistical Results | |
| Pearson's Chi-squared test with Yates' continuity correction | |
| Pearson Chi Square Statistic | 0.31 |
| Degrees of Freedom | 1 |
| P value | 0.58 |