Free Statistics

of Irreproducible Research!

Author's title

Author*Unverified author*
R Software Modulerwasp_autocorrelation.wasp
Title produced by software(Partial) Autocorrelation Function
Date of computationTue, 15 Nov 2011 07:07:22 -0500
Cite this page as followsStatistical Computations at FreeStatistics.org, Office for Research Development and Education, URL https://freestatistics.org/blog/index.php?v=date/2011/Nov/15/t1321358948gtoeosuzq4p8qsx.htm/, Retrieved Thu, 25 Apr 2024 01:49:14 +0000
Statistical Computations at FreeStatistics.org, Office for Research Development and Education, URL https://freestatistics.org/blog/index.php?pk=142799, Retrieved Thu, 25 Apr 2024 01:49:14 +0000
QR Codes:

Original text written by user:
IsPrivate?No (this computation is public)
User-defined keywords KDGP2W12
Estimated Impact78
Family? (F = Feedback message, R = changed R code, M = changed R Module, P = changed Parameters, D = changed Data)
-       [(Partial) Autocorrelation Function] [gemiddelde consum...] [2011-11-15 12:07:22] [bd8cebb9d7961275d2f6ed94788b7e5f] [Current]
Feedback Forum

Post a new message
Dataseries X:
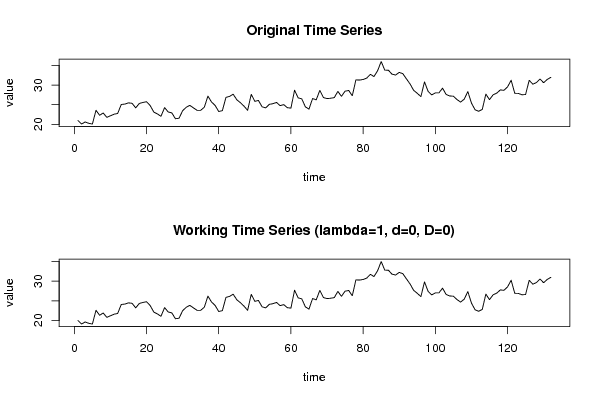
20.98		
20.1		
20.61		
20.27		
20.08		
23.58		
22.31		
22.89		
21.78		
22.19		
22.58		
22.78		
25.06		
25.16		
25.47		
25.34		
24.2		
25.32		
25.57		
25.76		
24.79		
23.14		
22.66		
22.06		
24.26		
23.15		
22.92		
21.43		
21.56		
23.48		
24.35		
24.83		
24.19		
23.58		
23.58		
24.35		
27.18		
25.69		
24.81		
23.26		
23.49		
26.86		
27.12		
27.66		
26.26		
25.51		
24.63		
23.57		
27.63		
25.85		
26.09		
24.47		
24.19		
25.09		
25.26		
25.58		
24.76		
25.02		
24.24		
24.14		
28.69		
26.74		
26.48		
24.45		
23.88		
26.58		
26.23		
28.63		
26.81		
26.56		
26.64		
26.8		
28.37		
27.13		
28.44		
28.62		
27.28		
31.32		
31.26		
31.41		
31.76		
32.72		
32.15		
33.62		
35.97		
33.78		
33.77		
32.75		
32.55		
33.22		
32.88		
31.56		
30.27		
28.65		
27.89		
27.07		
30.8		
28.38		
27.5		
28		
28.02		
29.2		
27.59		
27.22		
27.16		
26.31		
25.67		
26.41		
28.34		
25.43		
23.72		
23.33		
23.8		
27.7		
26.28		
27.51		
27.93		
28.76		
28.65		
29.52		
31.23		
27.9		
27.87		
27.52		
27.59		
31.2		
30.22		
30.62		
31.52		
30.59		
31.42		
31.95		


Summary of computational transaction
Raw Inputview raw input (R code)
Raw Outputview raw output of R engine
Computing time1 seconds
R Server'Herman Ole Andreas Wold' @ wold.wessa.net

\begin{tabular}{lllllllll}
\hline
Summary of computational transaction \tabularnewline
Raw Input & view raw input (R code)  \tabularnewline
Raw Output & view raw output of R engine  \tabularnewline
Computing time & 1 seconds \tabularnewline
R Server & 'Herman Ole Andreas Wold' @ wold.wessa.net \tabularnewline
\hline
\end{tabular}
%Source: https://freestatistics.org/blog/index.php?pk=142799&T=0

[TABLE]
[ROW][C]Summary of computational transaction[/C][/ROW]
[ROW][C]Raw Input[/C][C]view raw input (R code) [/C][/ROW]
[ROW][C]Raw Output[/C][C]view raw output of R engine [/C][/ROW]
[ROW][C]Computing time[/C][C]1 seconds[/C][/ROW]
[ROW][C]R Server[/C][C]'Herman Ole Andreas Wold' @ wold.wessa.net[/C][/ROW]
[/TABLE]
Source: https://freestatistics.org/blog/index.php?pk=142799&T=0

Globally Unique Identifier (entire table): ba.freestatistics.org/blog/index.php?pk=142799&T=0

As an alternative you can also use a QR Code:  

The GUIDs for individual cells are displayed in the table below:

Summary of computational transaction
Raw Inputview raw input (R code)
Raw Outputview raw output of R engine
Computing time1 seconds
R Server'Herman Ole Andreas Wold' @ wold.wessa.net


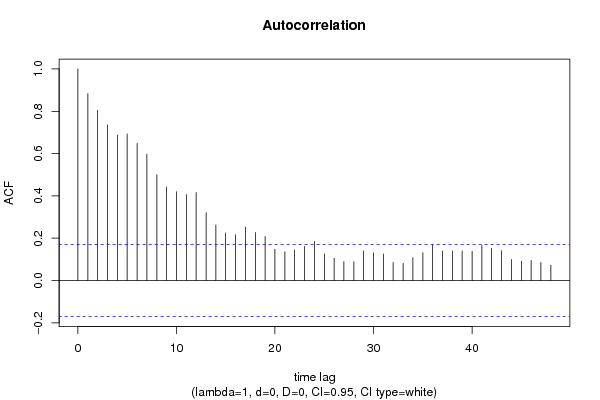
Autocorrelation Function
Time lag kACF(k)T-STATP-value
10.88316510.14680
20.8043339.24110
30.7349328.44370
40.6873647.89720
50.6927287.95880
60.6474497.43860
70.5969486.85840
80.499785.7420
90.4416585.07431e-06
100.4199674.82512e-06
110.4062934.6684e-06
120.4157864.7772e-06
130.3205993.68340.000167
140.2624343.01510.001541
150.2244892.57920.005499
160.2166672.48930.007021
170.252722.90350.002163
180.2270052.60810.005077
190.2084822.39530.009006
200.1475311.6950.046216
210.1356331.55830.060777
220.1448361.6640.049238
230.1606861.84610.033556
240.1841732.1160.018112
250.1251471.43780.076424
260.1051811.20840.114519
270.0888251.02050.154674
280.0888881.02120.154503
290.1397671.60580.055353
300.1309941.5050.067356
310.1251431.43780.076431
320.0848990.97540.16557
330.0804660.92450.178461
340.1085371.2470.107303
350.131841.51470.066117
360.1709931.96460.025783
370.1393851.60140.055838
380.1391321.59850.056161
390.1398411.60670.05526
400.1380691.58630.057533
410.1660841.90820.029271
420.1519671.7460.041572
430.1408681.61840.053977
440.0992361.14010.128148
450.0910471.04610.148724
460.0944491.08510.139921
470.0855580.9830.163705
480.0725280.83330.203096

\begin{tabular}{lllllllll}
\hline
Autocorrelation Function \tabularnewline
Time lag k & ACF(k) & T-STAT & P-value \tabularnewline
1 & 0.883165 & 10.1468 & 0 \tabularnewline
2 & 0.804333 & 9.2411 & 0 \tabularnewline
3 & 0.734932 & 8.4437 & 0 \tabularnewline
4 & 0.687364 & 7.8972 & 0 \tabularnewline
5 & 0.692728 & 7.9588 & 0 \tabularnewline
6 & 0.647449 & 7.4386 & 0 \tabularnewline
7 & 0.596948 & 6.8584 & 0 \tabularnewline
8 & 0.49978 & 5.742 & 0 \tabularnewline
9 & 0.441658 & 5.0743 & 1e-06 \tabularnewline
10 & 0.419967 & 4.8251 & 2e-06 \tabularnewline
11 & 0.406293 & 4.668 & 4e-06 \tabularnewline
12 & 0.415786 & 4.777 & 2e-06 \tabularnewline
13 & 0.320599 & 3.6834 & 0.000167 \tabularnewline
14 & 0.262434 & 3.0151 & 0.001541 \tabularnewline
15 & 0.224489 & 2.5792 & 0.005499 \tabularnewline
16 & 0.216667 & 2.4893 & 0.007021 \tabularnewline
17 & 0.25272 & 2.9035 & 0.002163 \tabularnewline
18 & 0.227005 & 2.6081 & 0.005077 \tabularnewline
19 & 0.208482 & 2.3953 & 0.009006 \tabularnewline
20 & 0.147531 & 1.695 & 0.046216 \tabularnewline
21 & 0.135633 & 1.5583 & 0.060777 \tabularnewline
22 & 0.144836 & 1.664 & 0.049238 \tabularnewline
23 & 0.160686 & 1.8461 & 0.033556 \tabularnewline
24 & 0.184173 & 2.116 & 0.018112 \tabularnewline
25 & 0.125147 & 1.4378 & 0.076424 \tabularnewline
26 & 0.105181 & 1.2084 & 0.114519 \tabularnewline
27 & 0.088825 & 1.0205 & 0.154674 \tabularnewline
28 & 0.088888 & 1.0212 & 0.154503 \tabularnewline
29 & 0.139767 & 1.6058 & 0.055353 \tabularnewline
30 & 0.130994 & 1.505 & 0.067356 \tabularnewline
31 & 0.125143 & 1.4378 & 0.076431 \tabularnewline
32 & 0.084899 & 0.9754 & 0.16557 \tabularnewline
33 & 0.080466 & 0.9245 & 0.178461 \tabularnewline
34 & 0.108537 & 1.247 & 0.107303 \tabularnewline
35 & 0.13184 & 1.5147 & 0.066117 \tabularnewline
36 & 0.170993 & 1.9646 & 0.025783 \tabularnewline
37 & 0.139385 & 1.6014 & 0.055838 \tabularnewline
38 & 0.139132 & 1.5985 & 0.056161 \tabularnewline
39 & 0.139841 & 1.6067 & 0.05526 \tabularnewline
40 & 0.138069 & 1.5863 & 0.057533 \tabularnewline
41 & 0.166084 & 1.9082 & 0.029271 \tabularnewline
42 & 0.151967 & 1.746 & 0.041572 \tabularnewline
43 & 0.140868 & 1.6184 & 0.053977 \tabularnewline
44 & 0.099236 & 1.1401 & 0.128148 \tabularnewline
45 & 0.091047 & 1.0461 & 0.148724 \tabularnewline
46 & 0.094449 & 1.0851 & 0.139921 \tabularnewline
47 & 0.085558 & 0.983 & 0.163705 \tabularnewline
48 & 0.072528 & 0.8333 & 0.203096 \tabularnewline
\hline
\end{tabular}
%Source: https://freestatistics.org/blog/index.php?pk=142799&T=1

[TABLE]
[ROW][C]Autocorrelation Function[/C][/ROW]
[ROW][C]Time lag k[/C][C]ACF(k)[/C][C]T-STAT[/C][C]P-value[/C][/ROW]
[ROW][C]1[/C][C]0.883165[/C][C]10.1468[/C][C]0[/C][/ROW]
[ROW][C]2[/C][C]0.804333[/C][C]9.2411[/C][C]0[/C][/ROW]
[ROW][C]3[/C][C]0.734932[/C][C]8.4437[/C][C]0[/C][/ROW]
[ROW][C]4[/C][C]0.687364[/C][C]7.8972[/C][C]0[/C][/ROW]
[ROW][C]5[/C][C]0.692728[/C][C]7.9588[/C][C]0[/C][/ROW]
[ROW][C]6[/C][C]0.647449[/C][C]7.4386[/C][C]0[/C][/ROW]
[ROW][C]7[/C][C]0.596948[/C][C]6.8584[/C][C]0[/C][/ROW]
[ROW][C]8[/C][C]0.49978[/C][C]5.742[/C][C]0[/C][/ROW]
[ROW][C]9[/C][C]0.441658[/C][C]5.0743[/C][C]1e-06[/C][/ROW]
[ROW][C]10[/C][C]0.419967[/C][C]4.8251[/C][C]2e-06[/C][/ROW]
[ROW][C]11[/C][C]0.406293[/C][C]4.668[/C][C]4e-06[/C][/ROW]
[ROW][C]12[/C][C]0.415786[/C][C]4.777[/C][C]2e-06[/C][/ROW]
[ROW][C]13[/C][C]0.320599[/C][C]3.6834[/C][C]0.000167[/C][/ROW]
[ROW][C]14[/C][C]0.262434[/C][C]3.0151[/C][C]0.001541[/C][/ROW]
[ROW][C]15[/C][C]0.224489[/C][C]2.5792[/C][C]0.005499[/C][/ROW]
[ROW][C]16[/C][C]0.216667[/C][C]2.4893[/C][C]0.007021[/C][/ROW]
[ROW][C]17[/C][C]0.25272[/C][C]2.9035[/C][C]0.002163[/C][/ROW]
[ROW][C]18[/C][C]0.227005[/C][C]2.6081[/C][C]0.005077[/C][/ROW]
[ROW][C]19[/C][C]0.208482[/C][C]2.3953[/C][C]0.009006[/C][/ROW]
[ROW][C]20[/C][C]0.147531[/C][C]1.695[/C][C]0.046216[/C][/ROW]
[ROW][C]21[/C][C]0.135633[/C][C]1.5583[/C][C]0.060777[/C][/ROW]
[ROW][C]22[/C][C]0.144836[/C][C]1.664[/C][C]0.049238[/C][/ROW]
[ROW][C]23[/C][C]0.160686[/C][C]1.8461[/C][C]0.033556[/C][/ROW]
[ROW][C]24[/C][C]0.184173[/C][C]2.116[/C][C]0.018112[/C][/ROW]
[ROW][C]25[/C][C]0.125147[/C][C]1.4378[/C][C]0.076424[/C][/ROW]
[ROW][C]26[/C][C]0.105181[/C][C]1.2084[/C][C]0.114519[/C][/ROW]
[ROW][C]27[/C][C]0.088825[/C][C]1.0205[/C][C]0.154674[/C][/ROW]
[ROW][C]28[/C][C]0.088888[/C][C]1.0212[/C][C]0.154503[/C][/ROW]
[ROW][C]29[/C][C]0.139767[/C][C]1.6058[/C][C]0.055353[/C][/ROW]
[ROW][C]30[/C][C]0.130994[/C][C]1.505[/C][C]0.067356[/C][/ROW]
[ROW][C]31[/C][C]0.125143[/C][C]1.4378[/C][C]0.076431[/C][/ROW]
[ROW][C]32[/C][C]0.084899[/C][C]0.9754[/C][C]0.16557[/C][/ROW]
[ROW][C]33[/C][C]0.080466[/C][C]0.9245[/C][C]0.178461[/C][/ROW]
[ROW][C]34[/C][C]0.108537[/C][C]1.247[/C][C]0.107303[/C][/ROW]
[ROW][C]35[/C][C]0.13184[/C][C]1.5147[/C][C]0.066117[/C][/ROW]
[ROW][C]36[/C][C]0.170993[/C][C]1.9646[/C][C]0.025783[/C][/ROW]
[ROW][C]37[/C][C]0.139385[/C][C]1.6014[/C][C]0.055838[/C][/ROW]
[ROW][C]38[/C][C]0.139132[/C][C]1.5985[/C][C]0.056161[/C][/ROW]
[ROW][C]39[/C][C]0.139841[/C][C]1.6067[/C][C]0.05526[/C][/ROW]
[ROW][C]40[/C][C]0.138069[/C][C]1.5863[/C][C]0.057533[/C][/ROW]
[ROW][C]41[/C][C]0.166084[/C][C]1.9082[/C][C]0.029271[/C][/ROW]
[ROW][C]42[/C][C]0.151967[/C][C]1.746[/C][C]0.041572[/C][/ROW]
[ROW][C]43[/C][C]0.140868[/C][C]1.6184[/C][C]0.053977[/C][/ROW]
[ROW][C]44[/C][C]0.099236[/C][C]1.1401[/C][C]0.128148[/C][/ROW]
[ROW][C]45[/C][C]0.091047[/C][C]1.0461[/C][C]0.148724[/C][/ROW]
[ROW][C]46[/C][C]0.094449[/C][C]1.0851[/C][C]0.139921[/C][/ROW]
[ROW][C]47[/C][C]0.085558[/C][C]0.983[/C][C]0.163705[/C][/ROW]
[ROW][C]48[/C][C]0.072528[/C][C]0.8333[/C][C]0.203096[/C][/ROW]
[/TABLE]
Source: https://freestatistics.org/blog/index.php?pk=142799&T=1

Globally Unique Identifier (entire table): ba.freestatistics.org/blog/index.php?pk=142799&T=1

As an alternative you can also use a QR Code:  

The GUIDs for individual cells are displayed in the table below:

Autocorrelation Function
Time lag kACF(k)T-STATP-value
10.88316510.14680
20.8043339.24110
30.7349328.44370
40.6873647.89720
50.6927287.95880
60.6474497.43860
70.5969486.85840
80.499785.7420
90.4416585.07431e-06
100.4199674.82512e-06
110.4062934.6684e-06
120.4157864.7772e-06
130.3205993.68340.000167
140.2624343.01510.001541
150.2244892.57920.005499
160.2166672.48930.007021
170.252722.90350.002163
180.2270052.60810.005077
190.2084822.39530.009006
200.1475311.6950.046216
210.1356331.55830.060777
220.1448361.6640.049238
230.1606861.84610.033556
240.1841732.1160.018112
250.1251471.43780.076424
260.1051811.20840.114519
270.0888251.02050.154674
280.0888881.02120.154503
290.1397671.60580.055353
300.1309941.5050.067356
310.1251431.43780.076431
320.0848990.97540.16557
330.0804660.92450.178461
340.1085371.2470.107303
350.131841.51470.066117
360.1709931.96460.025783
370.1393851.60140.055838
380.1391321.59850.056161
390.1398411.60670.05526
400.1380691.58630.057533
410.1660841.90820.029271
420.1519671.7460.041572
430.1408681.61840.053977
440.0992361.14010.128148
450.0910471.04610.148724
460.0944491.08510.139921
470.0855580.9830.163705
480.0725280.83330.203096


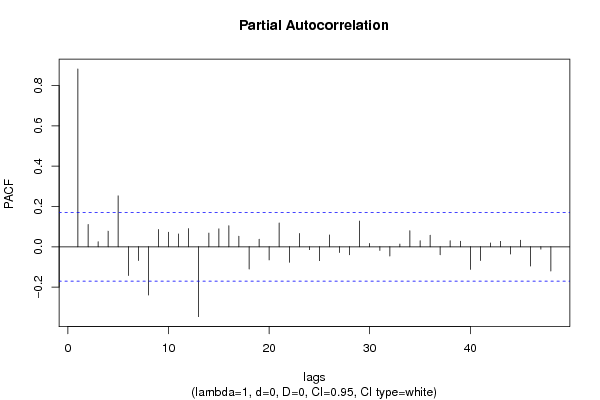
Partial Autocorrelation Function
Time lag kPACF(k)T-STATP-value
10.88316510.14680
20.1106821.27160.102869
30.025060.28790.386931
40.0775830.89140.187178
50.2528212.90470.002156
6-0.14248-1.6370.052009
7-0.068039-0.78170.217894
8-0.239619-2.7530.003369
90.085710.98470.163278
100.0719510.82670.204961
110.0631860.7260.234576
120.0900911.03510.151264
13-0.347097-3.98785.5e-05
140.0678440.77950.218548
150.0889631.02210.154299
160.1044421.19990.116155
170.05220.59970.274856
18-0.110218-1.26630.103816
190.0377060.43320.332785
20-0.065228-0.74940.22747
210.118321.35940.088169
22-0.077337-0.88850.187936
230.0662080.76070.224105
24-0.014303-0.16430.434862
25-0.068955-0.79220.214823
260.058370.67060.251817
27-0.028555-0.32810.371687
28-0.039934-0.45880.323564
290.1274891.46470.072685
300.0166720.19150.424195
31-0.018073-0.20760.417912
32-0.04628-0.53170.297909
330.0133540.15340.43915
340.0799190.91820.180096
350.0301630.34650.364743
360.0575910.66170.25467
37-0.039926-0.45870.323598
380.0300370.34510.365285
390.0270390.31070.378275
40-0.112161-1.28860.09989
41-0.068198-0.78350.217359
420.0183540.21090.416654
430.0266810.30650.379836
44-0.03571-0.41030.341134
450.0320430.36810.356676
46-0.095685-1.09930.136812
47-0.011786-0.13540.446248
48-0.120184-1.38080.084836

\begin{tabular}{lllllllll}
\hline
Partial Autocorrelation Function \tabularnewline
Time lag k & PACF(k) & T-STAT & P-value \tabularnewline
1 & 0.883165 & 10.1468 & 0 \tabularnewline
2 & 0.110682 & 1.2716 & 0.102869 \tabularnewline
3 & 0.02506 & 0.2879 & 0.386931 \tabularnewline
4 & 0.077583 & 0.8914 & 0.187178 \tabularnewline
5 & 0.252821 & 2.9047 & 0.002156 \tabularnewline
6 & -0.14248 & -1.637 & 0.052009 \tabularnewline
7 & -0.068039 & -0.7817 & 0.217894 \tabularnewline
8 & -0.239619 & -2.753 & 0.003369 \tabularnewline
9 & 0.08571 & 0.9847 & 0.163278 \tabularnewline
10 & 0.071951 & 0.8267 & 0.204961 \tabularnewline
11 & 0.063186 & 0.726 & 0.234576 \tabularnewline
12 & 0.090091 & 1.0351 & 0.151264 \tabularnewline
13 & -0.347097 & -3.9878 & 5.5e-05 \tabularnewline
14 & 0.067844 & 0.7795 & 0.218548 \tabularnewline
15 & 0.088963 & 1.0221 & 0.154299 \tabularnewline
16 & 0.104442 & 1.1999 & 0.116155 \tabularnewline
17 & 0.0522 & 0.5997 & 0.274856 \tabularnewline
18 & -0.110218 & -1.2663 & 0.103816 \tabularnewline
19 & 0.037706 & 0.4332 & 0.332785 \tabularnewline
20 & -0.065228 & -0.7494 & 0.22747 \tabularnewline
21 & 0.11832 & 1.3594 & 0.088169 \tabularnewline
22 & -0.077337 & -0.8885 & 0.187936 \tabularnewline
23 & 0.066208 & 0.7607 & 0.224105 \tabularnewline
24 & -0.014303 & -0.1643 & 0.434862 \tabularnewline
25 & -0.068955 & -0.7922 & 0.214823 \tabularnewline
26 & 0.05837 & 0.6706 & 0.251817 \tabularnewline
27 & -0.028555 & -0.3281 & 0.371687 \tabularnewline
28 & -0.039934 & -0.4588 & 0.323564 \tabularnewline
29 & 0.127489 & 1.4647 & 0.072685 \tabularnewline
30 & 0.016672 & 0.1915 & 0.424195 \tabularnewline
31 & -0.018073 & -0.2076 & 0.417912 \tabularnewline
32 & -0.04628 & -0.5317 & 0.297909 \tabularnewline
33 & 0.013354 & 0.1534 & 0.43915 \tabularnewline
34 & 0.079919 & 0.9182 & 0.180096 \tabularnewline
35 & 0.030163 & 0.3465 & 0.364743 \tabularnewline
36 & 0.057591 & 0.6617 & 0.25467 \tabularnewline
37 & -0.039926 & -0.4587 & 0.323598 \tabularnewline
38 & 0.030037 & 0.3451 & 0.365285 \tabularnewline
39 & 0.027039 & 0.3107 & 0.378275 \tabularnewline
40 & -0.112161 & -1.2886 & 0.09989 \tabularnewline
41 & -0.068198 & -0.7835 & 0.217359 \tabularnewline
42 & 0.018354 & 0.2109 & 0.416654 \tabularnewline
43 & 0.026681 & 0.3065 & 0.379836 \tabularnewline
44 & -0.03571 & -0.4103 & 0.341134 \tabularnewline
45 & 0.032043 & 0.3681 & 0.356676 \tabularnewline
46 & -0.095685 & -1.0993 & 0.136812 \tabularnewline
47 & -0.011786 & -0.1354 & 0.446248 \tabularnewline
48 & -0.120184 & -1.3808 & 0.084836 \tabularnewline
\hline
\end{tabular}
%Source: https://freestatistics.org/blog/index.php?pk=142799&T=2

[TABLE]
[ROW][C]Partial Autocorrelation Function[/C][/ROW]
[ROW][C]Time lag k[/C][C]PACF(k)[/C][C]T-STAT[/C][C]P-value[/C][/ROW]
[ROW][C]1[/C][C]0.883165[/C][C]10.1468[/C][C]0[/C][/ROW]
[ROW][C]2[/C][C]0.110682[/C][C]1.2716[/C][C]0.102869[/C][/ROW]
[ROW][C]3[/C][C]0.02506[/C][C]0.2879[/C][C]0.386931[/C][/ROW]
[ROW][C]4[/C][C]0.077583[/C][C]0.8914[/C][C]0.187178[/C][/ROW]
[ROW][C]5[/C][C]0.252821[/C][C]2.9047[/C][C]0.002156[/C][/ROW]
[ROW][C]6[/C][C]-0.14248[/C][C]-1.637[/C][C]0.052009[/C][/ROW]
[ROW][C]7[/C][C]-0.068039[/C][C]-0.7817[/C][C]0.217894[/C][/ROW]
[ROW][C]8[/C][C]-0.239619[/C][C]-2.753[/C][C]0.003369[/C][/ROW]
[ROW][C]9[/C][C]0.08571[/C][C]0.9847[/C][C]0.163278[/C][/ROW]
[ROW][C]10[/C][C]0.071951[/C][C]0.8267[/C][C]0.204961[/C][/ROW]
[ROW][C]11[/C][C]0.063186[/C][C]0.726[/C][C]0.234576[/C][/ROW]
[ROW][C]12[/C][C]0.090091[/C][C]1.0351[/C][C]0.151264[/C][/ROW]
[ROW][C]13[/C][C]-0.347097[/C][C]-3.9878[/C][C]5.5e-05[/C][/ROW]
[ROW][C]14[/C][C]0.067844[/C][C]0.7795[/C][C]0.218548[/C][/ROW]
[ROW][C]15[/C][C]0.088963[/C][C]1.0221[/C][C]0.154299[/C][/ROW]
[ROW][C]16[/C][C]0.104442[/C][C]1.1999[/C][C]0.116155[/C][/ROW]
[ROW][C]17[/C][C]0.0522[/C][C]0.5997[/C][C]0.274856[/C][/ROW]
[ROW][C]18[/C][C]-0.110218[/C][C]-1.2663[/C][C]0.103816[/C][/ROW]
[ROW][C]19[/C][C]0.037706[/C][C]0.4332[/C][C]0.332785[/C][/ROW]
[ROW][C]20[/C][C]-0.065228[/C][C]-0.7494[/C][C]0.22747[/C][/ROW]
[ROW][C]21[/C][C]0.11832[/C][C]1.3594[/C][C]0.088169[/C][/ROW]
[ROW][C]22[/C][C]-0.077337[/C][C]-0.8885[/C][C]0.187936[/C][/ROW]
[ROW][C]23[/C][C]0.066208[/C][C]0.7607[/C][C]0.224105[/C][/ROW]
[ROW][C]24[/C][C]-0.014303[/C][C]-0.1643[/C][C]0.434862[/C][/ROW]
[ROW][C]25[/C][C]-0.068955[/C][C]-0.7922[/C][C]0.214823[/C][/ROW]
[ROW][C]26[/C][C]0.05837[/C][C]0.6706[/C][C]0.251817[/C][/ROW]
[ROW][C]27[/C][C]-0.028555[/C][C]-0.3281[/C][C]0.371687[/C][/ROW]
[ROW][C]28[/C][C]-0.039934[/C][C]-0.4588[/C][C]0.323564[/C][/ROW]
[ROW][C]29[/C][C]0.127489[/C][C]1.4647[/C][C]0.072685[/C][/ROW]
[ROW][C]30[/C][C]0.016672[/C][C]0.1915[/C][C]0.424195[/C][/ROW]
[ROW][C]31[/C][C]-0.018073[/C][C]-0.2076[/C][C]0.417912[/C][/ROW]
[ROW][C]32[/C][C]-0.04628[/C][C]-0.5317[/C][C]0.297909[/C][/ROW]
[ROW][C]33[/C][C]0.013354[/C][C]0.1534[/C][C]0.43915[/C][/ROW]
[ROW][C]34[/C][C]0.079919[/C][C]0.9182[/C][C]0.180096[/C][/ROW]
[ROW][C]35[/C][C]0.030163[/C][C]0.3465[/C][C]0.364743[/C][/ROW]
[ROW][C]36[/C][C]0.057591[/C][C]0.6617[/C][C]0.25467[/C][/ROW]
[ROW][C]37[/C][C]-0.039926[/C][C]-0.4587[/C][C]0.323598[/C][/ROW]
[ROW][C]38[/C][C]0.030037[/C][C]0.3451[/C][C]0.365285[/C][/ROW]
[ROW][C]39[/C][C]0.027039[/C][C]0.3107[/C][C]0.378275[/C][/ROW]
[ROW][C]40[/C][C]-0.112161[/C][C]-1.2886[/C][C]0.09989[/C][/ROW]
[ROW][C]41[/C][C]-0.068198[/C][C]-0.7835[/C][C]0.217359[/C][/ROW]
[ROW][C]42[/C][C]0.018354[/C][C]0.2109[/C][C]0.416654[/C][/ROW]
[ROW][C]43[/C][C]0.026681[/C][C]0.3065[/C][C]0.379836[/C][/ROW]
[ROW][C]44[/C][C]-0.03571[/C][C]-0.4103[/C][C]0.341134[/C][/ROW]
[ROW][C]45[/C][C]0.032043[/C][C]0.3681[/C][C]0.356676[/C][/ROW]
[ROW][C]46[/C][C]-0.095685[/C][C]-1.0993[/C][C]0.136812[/C][/ROW]
[ROW][C]47[/C][C]-0.011786[/C][C]-0.1354[/C][C]0.446248[/C][/ROW]
[ROW][C]48[/C][C]-0.120184[/C][C]-1.3808[/C][C]0.084836[/C][/ROW]
[/TABLE]
Source: https://freestatistics.org/blog/index.php?pk=142799&T=2

Globally Unique Identifier (entire table): ba.freestatistics.org/blog/index.php?pk=142799&T=2

As an alternative you can also use a QR Code:  

The GUIDs for individual cells are displayed in the table below:

Partial Autocorrelation Function
Time lag kPACF(k)T-STATP-value
10.88316510.14680
20.1106821.27160.102869
30.025060.28790.386931
40.0775830.89140.187178
50.2528212.90470.002156
6-0.14248-1.6370.052009
7-0.068039-0.78170.217894
8-0.239619-2.7530.003369
90.085710.98470.163278
100.0719510.82670.204961
110.0631860.7260.234576
120.0900911.03510.151264
13-0.347097-3.98785.5e-05
140.0678440.77950.218548
150.0889631.02210.154299
160.1044421.19990.116155
170.05220.59970.274856
18-0.110218-1.26630.103816
190.0377060.43320.332785
20-0.065228-0.74940.22747
210.118321.35940.088169
22-0.077337-0.88850.187936
230.0662080.76070.224105
24-0.014303-0.16430.434862
25-0.068955-0.79220.214823
260.058370.67060.251817
27-0.028555-0.32810.371687
28-0.039934-0.45880.323564
290.1274891.46470.072685
300.0166720.19150.424195
31-0.018073-0.20760.417912
32-0.04628-0.53170.297909
330.0133540.15340.43915
340.0799190.91820.180096
350.0301630.34650.364743
360.0575910.66170.25467
37-0.039926-0.45870.323598
380.0300370.34510.365285
390.0270390.31070.378275
40-0.112161-1.28860.09989
41-0.068198-0.78350.217359
420.0183540.21090.416654
430.0266810.30650.379836
44-0.03571-0.41030.341134
450.0320430.36810.356676
46-0.095685-1.09930.136812
47-0.011786-0.13540.446248
48-0.120184-1.38080.084836


Parameters (Session):
par1 = 48 ; par2 = 1 ; par3 = 0 ; par4 = 0 ; par5 = 12 ; par6 = White Noise ; par7 = 0.95 ;
Parameters (R input):
par1 = 48 ; par2 = 1 ; par3 = 0 ; par4 = 0 ; par5 = 12 ; par6 = White Noise ; par7 = 0.95 ; par8 = ;
R code (references can be found in the software module):
if (par1 == 'Default') {
par1 = 10*log10(length(x))
} else {
par1 <- as.numeric(par1)
}
par2 <- as.numeric(par2)
par3 <- as.numeric(par3)
par4 <- as.numeric(par4)
par5 <- as.numeric(par5)
if (par6 == 'White Noise') par6 <- 'white' else par6 <- 'ma'
par7 <- as.numeric(par7)
if (par8 != '') par8 <- as.numeric(par8)
ox <- x
if (par8 == '') {
if (par2 == 0) {
x <- log(x)
} else {
x <- (x ^ par2 - 1) / par2
}
} else {
x <- log(x,base=par8)
}
if (par3 > 0) x <- diff(x,lag=1,difference=par3)
if (par4 > 0) x <- diff(x,lag=par5,difference=par4)
bitmap(file='picts.png')
op <- par(mfrow=c(2,1))
plot(ox,type='l',main='Original Time Series',xlab='time',ylab='value')
if (par8=='') {
mytitle <- paste('Working Time Series (lambda=',par2,', d=',par3,', D=',par4,')',sep='')
mysub <- paste('(lambda=',par2,', d=',par3,', D=',par4,', CI=', par7, ', CI type=',par6,')',sep='')
} else {
mytitle <- paste('Working Time Series (base=',par8,', d=',par3,', D=',par4,')',sep='')
mysub <- paste('(base=',par8,', d=',par3,', D=',par4,', CI=', par7, ', CI type=',par6,')',sep='')
}
plot(x,type='l', main=mytitle,xlab='time',ylab='value')
par(op)
dev.off()
bitmap(file='pic1.png')
racf <- acf(x, par1, main='Autocorrelation', xlab='time lag', ylab='ACF', ci.type=par6, ci=par7, sub=mysub)
dev.off()
bitmap(file='pic2.png')
rpacf <- pacf(x,par1,main='Partial Autocorrelation',xlab='lags',ylab='PACF',sub=mysub)
dev.off()
(myacf <- c(racf$acf))
(mypacf <- c(rpacf$acf))
lengthx <- length(x)
sqrtn <- sqrt(lengthx)
load(file='createtable')
a<-table.start()
a<-table.row.start(a)
a<-table.element(a,'Autocorrelation Function',4,TRUE)
a<-table.row.end(a)
a<-table.row.start(a)
a<-table.element(a,'Time lag k',header=TRUE)
a<-table.element(a,hyperlink('basics.htm','ACF(k)','click here for more information about the Autocorrelation Function'),header=TRUE)
a<-table.element(a,'T-STAT',header=TRUE)
a<-table.element(a,'P-value',header=TRUE)
a<-table.row.end(a)
for (i in 2:(par1+1)) {
a<-table.row.start(a)
a<-table.element(a,i-1,header=TRUE)
a<-table.element(a,round(myacf[i],6))
mytstat <- myacf[i]*sqrtn
a<-table.element(a,round(mytstat,4))
a<-table.element(a,round(1-pt(abs(mytstat),lengthx),6))
a<-table.row.end(a)
}
a<-table.end(a)
table.save(a,file='mytable.tab')
a<-table.start()
a<-table.row.start(a)
a<-table.element(a,'Partial Autocorrelation Function',4,TRUE)
a<-table.row.end(a)
a<-table.row.start(a)
a<-table.element(a,'Time lag k',header=TRUE)
a<-table.element(a,hyperlink('basics.htm','PACF(k)','click here for more information about the Partial Autocorrelation Function'),header=TRUE)
a<-table.element(a,'T-STAT',header=TRUE)
a<-table.element(a,'P-value',header=TRUE)
a<-table.row.end(a)
for (i in 1:par1) {
a<-table.row.start(a)
a<-table.element(a,i,header=TRUE)
a<-table.element(a,round(mypacf[i],6))
mytstat <- mypacf[i]*sqrtn
a<-table.element(a,round(mytstat,4))
a<-table.element(a,round(1-pt(abs(mytstat),lengthx),6))
a<-table.row.end(a)
}
a<-table.end(a)
table.save(a,file='mytable1.tab')