| Tabulation of Results | ||||
| Depression x Connected | ||||
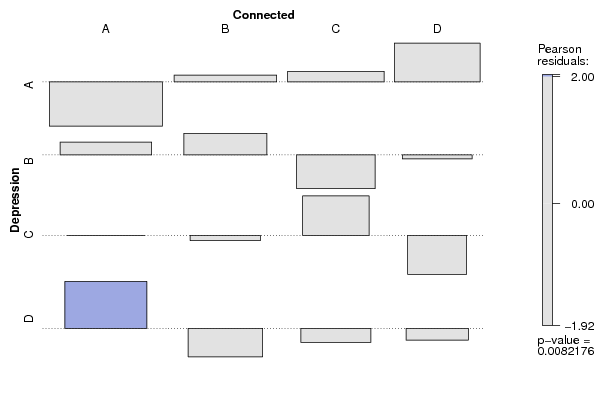
| A | B | C | D | A | 9 | 15 | 14 | 15 | B | 13 | 12 | 4 | 6 | C | 8 | 6 | 10 | 1 | D | 15 | 4 | 5 | 4 |
| Tabulation of Expected Results | ||||
| Depression x Connected | ||||
| A | B | C | D | A | 16.91 | 13.91 | 12.4 | 9.77 | B | 11.17 | 9.18 | 8.19 | 6.45 | C | 7.98 | 6.56 | 5.85 | 4.61 | D | 8.94 | 7.35 | 6.55 | 5.16 |
| Statistical Results | |
| Pearson's Chi-squared test | |
| Pearson Chi Square Statistic | 22.22 |
| Degrees of Freedom | 9 |
| P value | 0.01 |