| Multiple Linear Regression - Estimated Regression Equation |
| afstand[t] = -2.71600231617741 + 0.320463860057686schadebedrag[t] + e[t] |
| Multiple Linear Regression - Ordinary Least Squares | |||||
| Variable | Parameter | S.D. | T-STAT H0: parameter = 0 | 2-tail p-value | 1-tail p-value |
| (Intercept) | -2.71600231617741 | 0.456516 | -5.9494 | 0 | 0 |
| schadebedrag | 0.320463860057686 | 0.020684 | 15.4932 | 0 | 0 |
| Multiple Linear Regression - Regression Statistics | |
| Multiple R | 0.897437591050394 |
| R-squared | 0.805394229830334 |
| Adjusted R-squared | 0.802038957930858 |
| F-TEST (value) | 240.0384391965 |
| F-TEST (DF numerator) | 1 |
| F-TEST (DF denominator) | 58 |
| p-value | 0 |
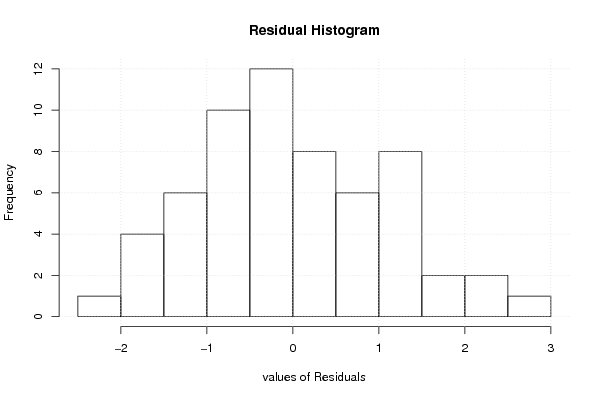
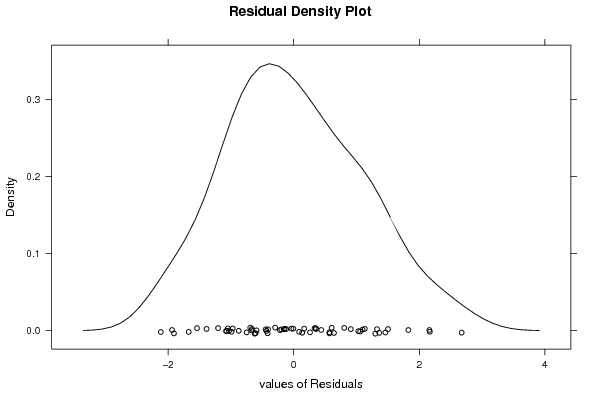
| Multiple Linear Regression - Residual Statistics | |
| Residual Standard Deviation | 1.09383263240868 |
| Sum Squared Residuals | 69.3952500078817 |
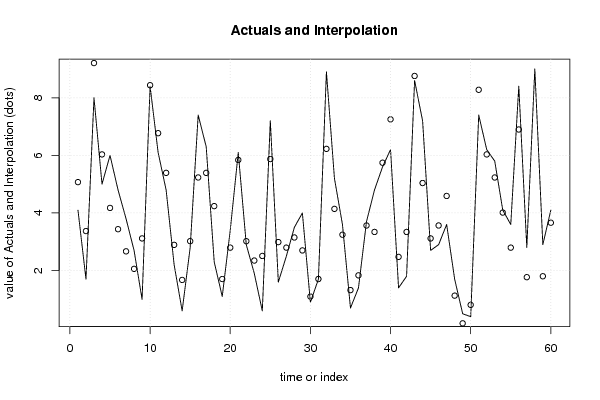
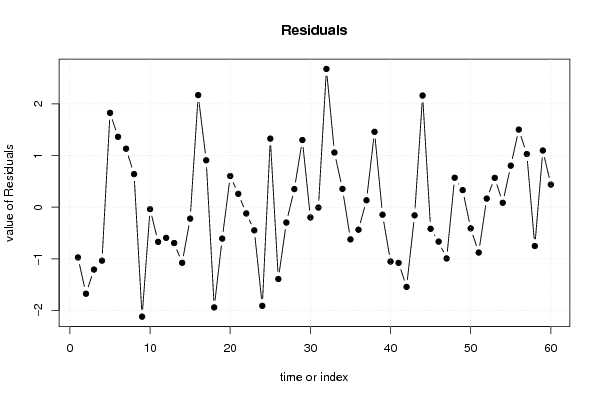
| Multiple Linear Regression - Actuals, Interpolation, and Residuals | |||
| Time or Index | Actuals | Interpolation Forecast | Residuals Prediction Error |
| 1 | 4.1 | 5.07126948322438 | -0.97126948322438 |
| 2 | 1.7 | 3.37281102491863 | -1.67281102491863 |
| 3 | 8 | 9.20525327796853 | -1.20525327796852 |
| 4 | 5 | 6.03266106339743 | -1.03266106339743 |
| 5 | 6 | 4.17397067506285 | 1.82602932493715 |
| 6 | 4.8 | 3.43690379693017 | 1.36309620306983 |
| 7 | 3.8 | 2.66779053279172 | 1.13220946720828 |
| 8 | 2.7 | 2.05890919868212 | 0.64109080131788 |
| 9 | 1 | 3.11643993687248 | -2.11643993687248 |
| 10 | 8.4 | 8.43614001383008 | -0.036140013830076 |
| 11 | 6.1 | 6.76972794153011 | -0.669727941530109 |
| 12 | 4.8 | 5.39173334328206 | -0.591733343282058 |
| 13 | 2.2 | 2.8921152348321 | -0.692115234832104 |
| 14 | 0.6 | 1.6743525666129 | -1.0743525666129 |
| 15 | 2.8 | 3.02030077885518 | -0.220300778855178 |
| 16 | 7.4 | 5.23150141325321 | 2.16849858674679 |
| 17 | 6.3 | 5.39173334328206 | 0.908266656717942 |
| 18 | 2.3 | 4.23806344707439 | -1.93806344707439 |
| 19 | 1.1 | 1.70639895261867 | -0.606398952618665 |
| 20 | 3.4 | 2.7959760768148 | 0.604023923185202 |
| 21 | 6.1 | 5.84038274736282 | 0.259617252637182 |
| 22 | 2.9 | 3.02030077885518 | -0.120300778855178 |
| 23 | 1.9 | 2.34732667273404 | -0.447326672734038 |
| 24 | 0.6 | 2.50755860276288 | -1.90755860276288 |
| 25 | 7.2 | 5.87242913336859 | 1.32757086663141 |
| 26 | 1.6 | 2.98825439284941 | -1.38825439284941 |
| 27 | 2.5 | 2.7959760768148 | -0.295976076814798 |
| 28 | 3.5 | 3.14848632287825 | 0.351513677121746 |
| 29 | 4 | 2.69983691879749 | 1.30016308120251 |
| 30 | 0.9 | 1.09751761850906 | -0.197517618509061 |
| 31 | 1.7 | 1.70639895261867 | -0.00639895261866516 |
| 32 | 8.9 | 6.22493937943204 | 2.67506062056796 |
| 33 | 5.2 | 4.14192428905708 | 1.05807571094292 |
| 34 | 3.6 | 3.24462548089556 | 0.35537451910444 |
| 35 | 0.7 | 1.32184232054944 | -0.621842320549441 |
| 36 | 1.4 | 1.83458449664174 | -0.434584496641739 |
| 37 | 3.7 | 3.56508934095325 | 0.134910659046754 |
| 38 | 4.8 | 3.34076463891286 | 1.45923536108714 |
| 39 | 5.6 | 5.74424358934551 | -0.144243589345512 |
| 40 | 6.2 | 7.25042373161664 | -1.05042373161664 |
| 41 | 1.4 | 2.47551221675711 | -1.07551221675711 |
| 42 | 1.8 | 3.34076463891286 | -1.54076463891286 |
| 43 | 8.6 | 8.75660387388776 | -0.156603873887763 |
| 44 | 7.2 | 5.0392230972186 | 2.1607769027814 |
| 45 | 2.7 | 3.11643993687248 | -0.416439936872484 |
| 46 | 2.9 | 3.56508934095325 | -0.665089340953246 |
| 47 | 3.6 | 4.59057369313784 | -0.990573693137842 |
| 48 | 1.7 | 1.12956400451483 | 0.570435995485171 |
| 49 | 0.5 | 0.168172424341771 | 0.331827575658229 |
| 50 | 0.4 | 0.809100144457143 | -0.409100144457143 |
| 51 | 7.4 | 8.27590808380123 | -0.875908083801233 |
| 52 | 6.2 | 6.03266106339743 | 0.16733893660257 |
| 53 | 5.8 | 5.23150141325321 | 0.568498586746785 |
| 54 | 4.1 | 4.01373874503401 | 0.0862612549659934 |
| 55 | 3.6 | 2.7959760768148 | 0.804023923185202 |
| 56 | 8.4 | 6.89791348555318 | 1.50208651444682 |
| 57 | 2.8 | 1.7704917246302 | 1.0295082753698 |
| 58 | 9 | 9.75004184006659 | -0.75004184006659 |
| 59 | 2.9 | 1.80253811063597 | 1.09746188936403 |
| 60 | 4.1 | 3.66122849897055 | 0.438771501029449 |
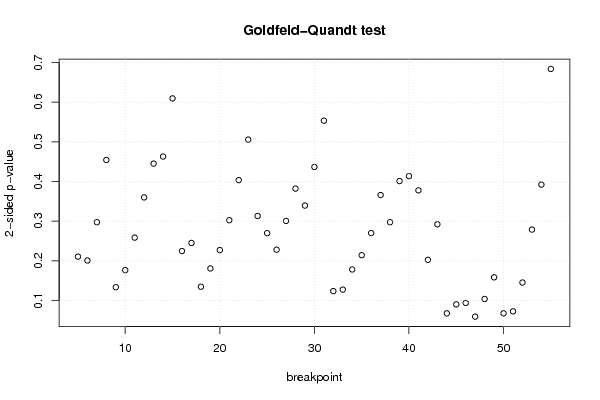
| Goldfeld-Quandt test for Heteroskedasticity | |||
| p-values | Alternative Hypothesis | ||
| breakpoint index | greater | 2-sided | less |
| 5 | 0.894777722369325 | 0.210444555261349 | 0.105222277630675 |
| 6 | 0.899608518663972 | 0.200782962672055 | 0.100391481336028 |
| 7 | 0.85140984769324 | 0.29718030461352 | 0.14859015230676 |
| 8 | 0.772948294246078 | 0.454103411507844 | 0.227051705753922 |
| 9 | 0.933337538118299 | 0.133324923763401 | 0.0666624618817007 |
| 10 | 0.911820929197071 | 0.176358141605857 | 0.0881790708029287 |
| 11 | 0.870801354173934 | 0.258397291652132 | 0.129198645826066 |
| 12 | 0.820090188924934 | 0.359819622150132 | 0.179909811075066 |
| 13 | 0.777499451355465 | 0.445001097289071 | 0.222500548644535 |
| 14 | 0.768578651423436 | 0.462842697153128 | 0.231421348576564 |
| 15 | 0.695290713446607 | 0.609418573106786 | 0.304709286553393 |
| 16 | 0.887695659745414 | 0.224608680509171 | 0.112304340254586 |
| 17 | 0.877509441421439 | 0.244981117157122 | 0.122490558578561 |
| 18 | 0.932701806764457 | 0.134596386471086 | 0.0672981932355431 |
| 19 | 0.909649302340015 | 0.18070139531997 | 0.0903506976599851 |
| 20 | 0.886502509397644 | 0.226994981204711 | 0.113497490602356 |
| 21 | 0.8488754539195 | 0.302249092161 | 0.1511245460805 |
| 22 | 0.798364807333628 | 0.403270385332743 | 0.201635192666372 |
| 23 | 0.747237349038101 | 0.505525301923799 | 0.252762650961899 |
| 24 | 0.84354903581568 | 0.312901928368641 | 0.15645096418432 |
| 25 | 0.865209055188531 | 0.269581889622937 | 0.134790944811469 |
| 26 | 0.886022558943817 | 0.227954882112367 | 0.113977441056183 |
| 27 | 0.84980239893782 | 0.30039520212436 | 0.15019760106218 |
| 28 | 0.808960063561328 | 0.382079872877344 | 0.191039936438672 |
| 29 | 0.830401888060348 | 0.339196223879305 | 0.169598111939652 |
| 30 | 0.78173487243643 | 0.436530255127139 | 0.21826512756357 |
| 31 | 0.723406590448987 | 0.553186819102026 | 0.276593409551013 |
| 32 | 0.938245822903948 | 0.123508354192105 | 0.0617541770960523 |
| 33 | 0.936362764003667 | 0.127274471992666 | 0.0636372359963332 |
| 34 | 0.910931998414519 | 0.178136003170962 | 0.0890680015854808 |
| 35 | 0.892944568826267 | 0.214110862347465 | 0.107055431173733 |
| 36 | 0.865098424568471 | 0.269803150863057 | 0.134901575431529 |
| 37 | 0.817172006676833 | 0.365655986646334 | 0.182827993323167 |
| 38 | 0.851351467779881 | 0.297297064440238 | 0.148648532220119 |
| 39 | 0.799515626202387 | 0.400968747595225 | 0.200484373797613 |
| 40 | 0.793273642600179 | 0.413452714799643 | 0.206726357399822 |
| 41 | 0.811218379270431 | 0.377563241459138 | 0.188781620729569 |
| 42 | 0.898773739576193 | 0.202452520847614 | 0.101226260423807 |
| 43 | 0.854000620702801 | 0.291998758594398 | 0.145999379297199 |
| 44 | 0.966222645697049 | 0.067554708605902 | 0.033777354302951 |
| 45 | 0.954975523966608 | 0.0900489520667831 | 0.0450244760333916 |
| 46 | 0.953185880924738 | 0.0936282381505233 | 0.0468141190752617 |
| 47 | 0.970420134342383 | 0.0591597313152345 | 0.0295798656576173 |
| 48 | 0.948162488759169 | 0.103675022481663 | 0.0518375112408315 |
| 49 | 0.9208691680262 | 0.1582616639476 | 0.0791308319737999 |
| 50 | 0.966196080517533 | 0.0676078389649349 | 0.0338039194824675 |
| 51 | 0.963766765461919 | 0.072466469076162 | 0.036233234538081 |
| 52 | 0.927412356523235 | 0.145175286953531 | 0.0725876434767653 |
| 53 | 0.86066089702181 | 0.278678205956381 | 0.13933910297819 |
| 54 | 0.803963202678845 | 0.392073594642311 | 0.196036797321155 |
| 55 | 0.658196793137624 | 0.683606413724752 | 0.341803206862376 |
| Meta Analysis of Goldfeld-Quandt test for Heteroskedasticity | |||
| Description | # significant tests | % significant tests | OK/NOK |
| 1% type I error level | 0 | 0 | OK |
| 5% type I error level | 0 | 0 | OK |
| 10% type I error level | 6 | 0.117647058823529 | NOK |